|
Download Data (XLS File) |
|
||||||||
|
||||||||
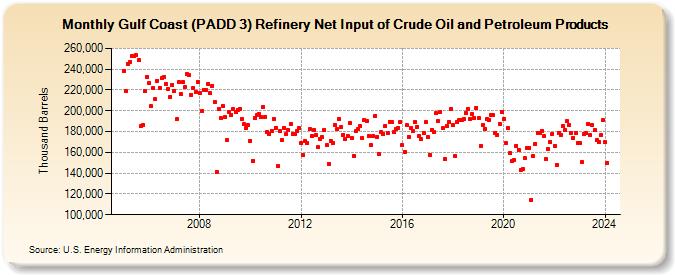
| Gulf Coast (PADD 3) Refinery Net Input of Crude Oil and Petroleum Products (Thousand Barrels) | ||||||||
| Year | Jan | Feb | Mar | Apr | May | Jun | Jul | Aug | Sep | Oct | Nov | Dec |
|---|---|---|---|---|---|---|---|---|---|---|---|---|
| 2005 | 238,590 | 219,085 | 245,325 | 247,046 | 252,359 | 252,219 | 253,383 | 248,502 | 185,028 | 186,298 | 218,546 | 232,791 |
| 2006 | 226,934 | 204,335 | 221,763 | 210,995 | 229,107 | 222,192 | 231,042 | 232,446 | 225,982 | 221,395 | 213,324 | 224,678 |
| 2007 | 219,046 | 191,736 | 227,378 | 216,318 | 227,246 | 222,428 | 235,361 | 234,551 | 215,531 | 222,202 | 218,526 | 227,733 |
| 2008 | 217,135 | 199,608 | 220,172 | 220,018 | 226,000 | 216,988 | 223,833 | 208,574 | 141,177 | 202,142 | 192,826 | 204,737 |
| 2009 | 193,631 | 171,523 | 198,970 | 195,922 | 201,228 | 198,364 | 201,160 | 202,172 | 192,335 | 187,153 | 183,264 | 185,880 |
| 2010 | 171,185 | 151,986 | 193,236 | 195,610 | 196,538 | 193,589 | 203,391 | 194,074 | 179,451 | 177,390 | 180,506 | 192,286 |
| 2011 | 183,478 | 147,042 | 180,206 | 171,931 | 183,852 | 177,688 | 181,255 | 187,145 | 177,474 | 177,513 | 180,353 | 183,368 |
| 2012 | 169,138 | 157,450 | 171,340 | 169,019 | 182,020 | 175,350 | 181,404 | 176,392 | 164,805 | 173,189 | 174,543 | 181,332 |
| 2013 | 166,800 | 148,893 | 171,045 | 168,802 | 186,672 | 182,207 | 192,514 | 184,729 | 177,111 | 172,772 | 176,054 | 188,423 |
| 2014 | 173,913 | 156,885 | 180,398 | 182,099 | 184,897 | 173,570 | 190,893 | 189,934 | 175,847 | 167,297 | 175,603 | 195,364 |
| 2015 | 175,230 | 158,098 | 179,880 | 177,460 | 185,519 | 178,854 | 189,569 | 188,824 | 179,764 | 182,614 | 183,729 | 189,616 |
| 2016 | 166,807 | 160,580 | 186,029 | 174,973 | 183,074 | 180,713 | 189,630 | 184,778 | 175,859 | 172,813 | 178,810 | 188,829 |
| 2017 | 174,869 | 157,697 | 181,769 | 179,090 | 197,441 | 189,749 | 198,900 | 183,142 | 153,462 | 185,704 | 189,155 | 201,971 |
| 2018 | 186,180 | 156,503 | 188,916 | 191,211 | 190,884 | 192,070 | 198,322 | 202,046 | 192,313 | 196,840 | 193,073 | 202,524 |
| 2019 | 192,651 | 166,529 | 186,462 | 182,883 | 192,355 | 191,152 | 195,959 | 196,060 | 178,986 | 176,922 | 187,279 | 198,427 |
| 2020 | 192,397 | 168,541 | 183,613 | 159,140 | 151,515 | 152,515 | 166,310 | 162,605 | 143,000 | 143,723 | 154,261 | 164,518 |
| 2021 | 164,556 | 114,585 | 156,355 | 168,438 | 178,975 | 178,488 | 180,931 | 175,426 | 153,230 | 163,239 | 169,793 | 178,064 |
| 2022 | 166,501 | 148,137 | 179,041 | 176,858 | 185,108 | 181,489 | 189,861 | 186,463 | 179,032 | 174,219 | 178,680 | 169,019 |
| 2023 | 169,054 | 150,680 | 177,961 | 178,211 | 187,496 | 176,495 | 186,378 | 181,153 | 171,400 | 170,135 | 176,267 | 190,736 |
| 2024 | 169,594 | |||||||||||
| - = No Data Reported; -- = Not Applicable; NA = Not Available; W = Withheld to avoid disclosure of individual company data. |
| Release Date: 3/29/2024 |
| Next Release Date: 4/30/2024 |