|
Download Data (XLS File) |
|
||||||||
|
||||||||
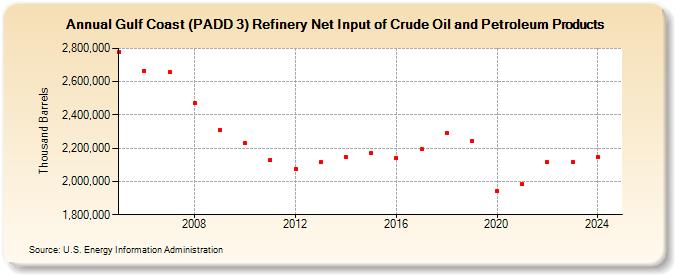
| Gulf Coast (PADD 3) Refinery Net Input of Crude Oil and Petroleum Products (Thousand Barrels) | ||||||||
| Decade | Year-0 | Year-1 | Year-2 | Year-3 | Year-4 | Year-5 | Year-6 | Year-7 | Year-8 | Year-9 |
|---|---|---|---|---|---|---|---|---|---|---|
| 2000's | 2,779,172 | 2,664,193 | 2,658,056 | 2,473,210 | 2,311,602 | |||||
| 2010's | 2,229,242 | 2,131,305 | 2,075,982 | 2,116,022 | 2,146,700 | 2,169,157 | 2,142,895 | 2,192,949 | 2,290,882 | 2,245,665 |
| 2020's | 1,942,138 | 1,982,080 | 2,114,408 | 2,115,966 |
| - = No Data Reported; -- = Not Applicable; NA = Not Available; W = Withheld to avoid disclosure of individual company data. |
| Release Date: 3/29/2024 |
| Next Release Date: 8/30/2024 |