|
Download Data (XLS File) |
|
||||||||
|
||||||||
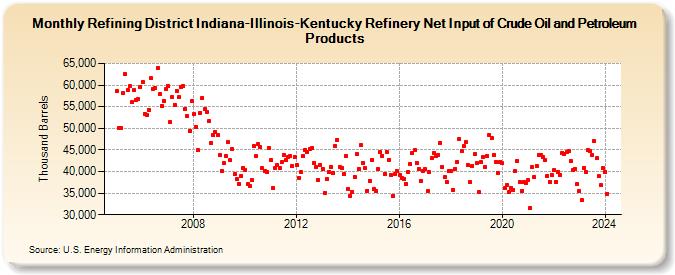
| Refining District Indiana-Illinois-Kentucky Refinery Net Input of Crude Oil and Petroleum Products (Thousand Barrels) | ||||||||
| Year | Jan | Feb | Mar | Apr | May | Jun | Jul | Aug | Sep | Oct | Nov | Dec |
|---|---|---|---|---|---|---|---|---|---|---|---|---|
| 2005 | 58,588 | 50,146 | 50,021 | 58,072 | 62,459 | 58,854 | 59,673 | 55,973 | 58,768 | 56,655 | 56,735 | 59,581 |
| 2006 | 60,665 | 53,351 | 53,162 | 54,160 | 61,531 | 59,165 | 59,332 | 64,038 | 57,970 | 55,253 | 56,341 | 58,995 |
| 2007 | 59,755 | 51,446 | 57,252 | 55,475 | 58,686 | 57,192 | 59,564 | 59,756 | 54,495 | 52,745 | 49,375 | 56,224 |
| 2008 | 53,201 | 50,333 | 44,888 | 53,599 | 57,114 | 54,353 | 53,739 | 51,591 | 46,624 | 48,461 | 49,103 | 48,437 |
| 2009 | 43,776 | 40,173 | 41,863 | 43,547 | 46,727 | 42,587 | 45,176 | 39,322 | 38,273 | 37,193 | 39,007 | 40,868 |
| 2010 | 40,369 | 37,058 | 36,600 | 37,988 | 45,885 | 43,492 | 46,333 | 45,647 | 40,701 | 40,201 | 39,981 | 45,529 |
| 2011 | 42,614 | 36,105 | 40,733 | 41,546 | 40,729 | 42,124 | 43,888 | 42,590 | 43,292 | 43,473 | 41,272 | 43,420 |
| 2012 | 41,467 | 38,470 | 39,857 | 43,632 | 45,074 | 44,409 | 45,210 | 45,470 | 42,031 | 41,145 | 38,070 | 41,615 |
| 2013 | 40,610 | 35,082 | 38,193 | 39,959 | 41,121 | 39,563 | 45,922 | 47,404 | 41,060 | 40,791 | 39,382 | 43,559 |
| 2014 | 36,005 | 34,335 | 35,229 | 38,808 | 43,978 | 40,660 | 46,130 | 41,969 | 40,854 | 35,562 | 37,859 | 42,758 |
| 2015 | 35,953 | 35,493 | 40,511 | 44,470 | 43,664 | 39,450 | 44,603 | 42,724 | 39,206 | 34,355 | 39,460 | 40,006 |
| 2016 | 39,233 | 38,574 | 38,235 | 37,152 | 39,952 | 41,850 | 44,240 | 44,941 | 42,045 | 40,555 | 37,866 | 40,183 |
| 2017 | 40,494 | 35,416 | 39,818 | 43,097 | 44,321 | 43,671 | 43,886 | 46,624 | 41,067 | 38,684 | 37,608 | 40,202 |
| 2018 | 40,068 | 35,778 | 40,650 | 42,184 | 47,571 | 44,842 | 45,898 | 46,730 | 41,538 | 37,557 | 41,229 | 43,982 |
| 2019 | 41,885 | 35,169 | 42,101 | 43,380 | 41,079 | 43,609 | 48,485 | 47,677 | 43,897 | 42,270 | 39,712 | 42,261 |
| 2020 | 41,905 | 36,233 | 36,827 | 35,147 | 36,276 | 35,792 | 40,065 | 42,470 | 37,584 | 35,534 | 37,610 | 37,251 |
| 2021 | 38,073 | 31,595 | 41,027 | 38,673 | 41,383 | 43,915 | 43,733 | 43,282 | 42,568 | 38,968 | 37,546 | 39,253 |
| 2022 | 40,258 | 37,644 | 39,892 | 39,240 | 44,393 | 44,098 | 44,484 | 44,753 | 42,332 | 40,359 | 40,625 | 37,089 |
| 2023 | 35,439 | 33,332 | 40,868 | 39,974 | 44,937 | 44,839 | 43,912 | 47,035 | 43,071 | 39,018 | 36,814 | 40,878 |
| 2024 | 39,967 | 34,876 | 38,105 | 37,280 | 46,328 | 44,690 | ||||||
| - = No Data Reported; -- = Not Applicable; NA = Not Available; W = Withheld to avoid disclosure of individual company data. |
| Release Date: 8/30/2024 |
| Next Release Date: 9/30/2024 |