|
Download Data (XLS File) |
|
||||||||
|
||||||||
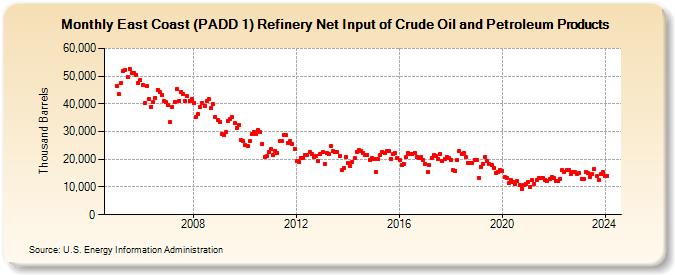
| East Coast (PADD 1) Refinery Net Input of Crude Oil and Petroleum Products (Thousand Barrels) | ||||||||
| Year | Jan | Feb | Mar | Apr | May | Jun | Jul | Aug | Sep | Oct | Nov | Dec |
|---|---|---|---|---|---|---|---|---|---|---|---|---|
| 2005 | 46,489 | 43,417 | 47,607 | 51,830 | 52,264 | 49,624 | 52,544 | 51,146 | 51,202 | 50,523 | 47,392 | 48,748 |
| 2006 | 46,918 | 40,480 | 46,391 | 41,704 | 39,037 | 40,569 | 42,219 | 45,087 | 44,121 | 43,212 | 41,101 | 40,505 |
| 2007 | 39,481 | 33,574 | 38,806 | 40,669 | 45,427 | 41,167 | 44,267 | 43,585 | 40,872 | 42,787 | 41,145 | 41,672 |
| 2008 | 40,355 | 35,289 | 36,174 | 38,916 | 40,182 | 39,286 | 40,971 | 41,606 | 38,596 | 39,901 | 35,170 | 34,199 |
| 2009 | 33,621 | 29,067 | 28,867 | 29,860 | 33,953 | 34,509 | 35,281 | 33,013 | 31,329 | 32,291 | 26,899 | 26,581 |
| 2010 | 25,016 | 24,729 | 26,436 | 28,952 | 29,961 | 29,134 | 30,642 | 29,705 | 25,620 | 20,910 | 21,079 | 22,533 |
| 2011 | 23,652 | 21,411 | 22,805 | 22,291 | 26,455 | 26,416 | 28,810 | 28,617 | 25,960 | 26,555 | 25,583 | 23,717 |
| 2012 | 19,300 | 18,967 | 20,345 | 20,495 | 21,648 | 21,668 | 22,538 | 21,983 | 20,730 | 21,326 | 19,338 | 21,838 |
| 2013 | 22,494 | 18,314 | 22,382 | 21,777 | 24,656 | 22,814 | 22,444 | 22,492 | 21,205 | 16,108 | 16,706 | 20,830 |
| 2014 | 18,787 | 17,410 | 19,142 | 20,358 | 22,779 | 23,248 | 22,974 | 22,407 | 21,371 | 21,709 | 19,882 | 20,343 |
| 2015 | 20,158 | 15,470 | 20,051 | 21,534 | 22,705 | 22,296 | 22,885 | 23,149 | 20,094 | 22,062 | 22,083 | 20,464 |
| 2016 | 19,882 | 17,851 | 18,385 | 20,685 | 22,362 | 21,860 | 21,743 | 22,122 | 20,790 | 20,422 | 20,675 | 19,650 |
| 2017 | 18,431 | 15,341 | 17,765 | 20,390 | 21,536 | 21,337 | 20,170 | 22,000 | 19,233 | 19,925 | 20,998 | 20,508 |
| 2018 | 19,799 | 16,004 | 15,940 | 19,770 | 22,856 | 21,926 | 22,316 | 20,829 | 18,825 | 18,499 | 18,740 | 19,808 |
| 2019 | 19,737 | 13,390 | 17,218 | 18,388 | 20,961 | 19,372 | 18,207 | 18,028 | 16,922 | 15,177 | 15,546 | 16,094 |
| 2020 | 15,920 | 13,579 | 13,383 | 11,359 | 12,364 | 11,959 | 11,119 | 12,070 | 10,605 | 9,450 | 10,643 | 11,253 |
| 2021 | 11,817 | 10,111 | 12,521 | 11,207 | 12,511 | 13,230 | 13,221 | 13,197 | 12,663 | 12,144 | 12,961 | 13,614 |
| 2022 | 13,210 | 11,982 | 12,334 | 12,947 | 15,966 | 15,453 | 16,159 | 16,017 | 14,812 | 15,380 | 15,271 | 14,813 |
| 2023 | 14,925 | 12,934 | 13,015 | 15,569 | 15,110 | 13,742 | 14,598 | 16,439 | 13,823 | 12,553 | 14,691 | 15,370 |
| 2024 | 13,807 | |||||||||||
| - = No Data Reported; -- = Not Applicable; NA = Not Available; W = Withheld to avoid disclosure of individual company data. |
| Release Date: 3/29/2024 |
| Next Release Date: 4/30/2024 |