|
Download Data (XLS File) |
|
||||||||
|
||||||||
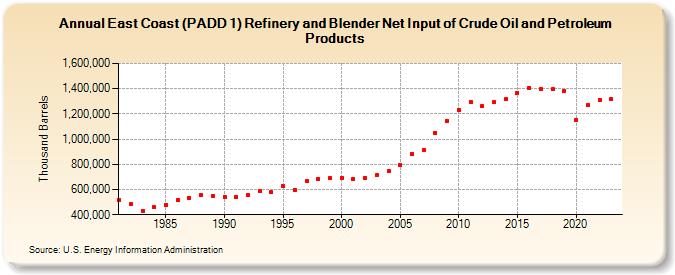
| East Coast (PADD 1) Refinery and Blender Net Input of Crude Oil and Petroleum Products (Thousand Barrels) | ||||||||
| Decade | Year-0 | Year-1 | Year-2 | Year-3 | Year-4 | Year-5 | Year-6 | Year-7 | Year-8 | Year-9 |
|---|---|---|---|---|---|---|---|---|---|---|
| 1980's | 520,211 | 481,284 | 432,112 | 457,491 | 478,572 | 517,361 | 531,371 | 557,818 | 550,159 | |
| 1990's | 540,987 | 540,592 | 553,714 | 584,765 | 576,793 | 627,182 | 599,331 | 664,182 | 684,258 | 689,415 |
| 2000's | 693,964 | 685,081 | 692,593 | 712,227 | 749,531 | 793,244 | 883,732 | 914,932 | 1,049,191 | 1,143,654 |
| 2010's | 1,232,907 | 1,295,303 | 1,260,324 | 1,291,384 | 1,316,609 | 1,368,186 | 1,408,227 | 1,395,135 | 1,394,589 | 1,384,068 |
| 2020's | 1,153,982 | 1,269,737 | 1,311,217 | 1,320,714 |
| - = No Data Reported; -- = Not Applicable; NA = Not Available; W = Withheld to avoid disclosure of individual company data. |
| Release Date: 3/29/2024 |
| Next Release Date: 8/30/2024 |