|
Download Data (XLS File) |
|
||||||||
|
||||||||
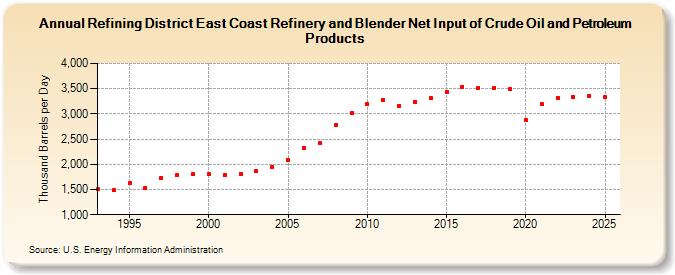
| Refining District East Coast Refinery and Blender Net Input of Crude Oil and Petroleum Products (Thousand Barrels per Day) | ||||||||
| Decade | Year-0 | Year-1 | Year-2 | Year-3 | Year-4 | Year-5 | Year-6 | Year-7 | Year-8 | Year-9 |
|---|---|---|---|---|---|---|---|---|---|---|
| 1990's | 1,505 | 1,484 | 1,622 | 1,539 | 1,729 | 1,785 | 1,798 | |||
| 2000's | 1,809 | 1,791 | 1,811 | 1,860 | 1,956 | 2,077 | 2,326 | 2,417 | 2,771 | 3,020 |
| 2010's | 3,192 | 3,273 | 3,157 | 3,243 | 3,312 | 3,441 | 3,540 | 3,522 | 3,522 | 3,486 |
| 2020's | 2,886 | 3,196 | 3,317 | 3,330 |
| - = No Data Reported; -- = Not Applicable; NA = Not Available; W = Withheld to avoid disclosure of individual company data. |
| Release Date: 3/29/2024 |
| Next Release Date: 8/30/2024 |