|
Download Data (XLS File) |
|
||||||||
|
||||||||
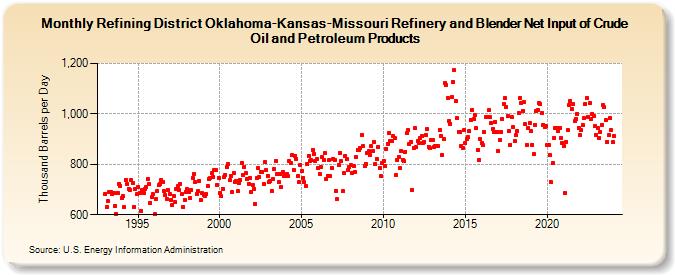
| Refining District Oklahoma-Kansas-Missouri Refinery and Blender Net Input of Crude Oil and Petroleum Products (Thousand Barrels per Day) | ||||||||
| Year | Jan | Feb | Mar | Apr | May | Jun | Jul | Aug | Sep | Oct | Nov | Dec |
|---|---|---|---|---|---|---|---|---|---|---|---|---|
| 1993 | 683 | 630 | 653 | 689 | 691 | 684 | 686 | 634 | 604 | 688 | 723 | 713 |
| 1994 | 666 | 673 | 629 | 738 | 722 | 704 | 699 | 737 | 726 | 631 | 703 | 681 |
| 1995 | 710 | 688 | 615 | 697 | 688 | 704 | 708 | 740 | 722 | 648 | 670 | 681 |
| 1996 | 601 | 662 | 695 | 716 | 723 | 738 | 728 | 693 | 678 | 662 | 697 | 683 |
| 1997 | 660 | 640 | 675 | 651 | 702 | 713 | 699 | 723 | 682 | 632 | 660 | 692 |
| 1998 | 702 | 690 | 665 | 697 | 746 | 762 | 729 | 683 | 693 | 734 | 659 | 685 |
| 1999 | 680 | 675 | 682 | 714 | 741 | 746 | 764 | 750 | 777 | 778 | 718 | 746 |
| 2000 | 687 | 673 | 703 | 748 | 757 | 788 | 802 | 736 | 755 | 690 | 766 | 731 |
| 2001 | 735 | 693 | 726 | 738 | 807 | 758 | 791 | 765 | 743 | 723 | 746 | 691 |
| 2002 | 718 | 704 | 642 | 746 | 785 | 750 | 771 | 770 | 720 | 809 | 777 | 755 |
| 2003 | 729 | 732 | 695 | 743 | 782 | 815 | 760 | 729 | 762 | 709 | 769 | 753 |
| 2004 | 759 | 762 | 752 | 812 | 804 | 835 | 777 | 834 | 822 | 753 | 728 | 798 |
| 2005 | 775 | 746 | 728 | 714 | 802 | 834 | 815 | 816 | 857 | 842 | 814 | 822 |
| 2006 | 784 | 763 | 790 | 827 | 817 | 844 | 741 | 755 | 816 | 753 | 787 | 822 |
| 2007 | 816 | 696 | 661 | 798 | 846 | 812 | 693 | 764 | 834 | 820 | 776 | 789 |
| 2008 | 796 | 766 | 793 | 771 | 829 | 857 | 856 | 866 | 918 | 871 | 795 | 803 |
| 2009 | 843 | 851 | 838 | 871 | 852 | 890 | 801 | 823 | 870 | 786 | 752 | 807 |
| 2010 | 815 | 793 | 862 | 882 | 924 | 891 | 892 | 911 | 903 | 756 | 816 | 829 |
| 2011 | 784 | 852 | 819 | 812 | 850 | 923 | 936 | 880 | 890 | 700 | 865 | 944 |
| 2012 | 867 | 892 | 883 | 904 | 914 | 885 | 889 | 915 | 941 | 870 | 863 | 895 |
| 2013 | 896 | 869 | 873 | 871 | 871 | 935 | 914 | 837 | 901 | 1,122 | 1,115 | 1,064 |
| 2014 | 971 | 961 | 1,067 | 1,126 | 1,173 | 1,052 | 982 | 929 | 928 | 873 | 866 | 936 |
| 2015 | 885 | 899 | 908 | 931 | 977 | 1,016 | 979 | 994 | 943 | 858 | 818 | 900 |
| 2016 | 884 | 876 | 928 | 988 | 988 | 1,014 | 986 | 964 | 940 | 930 | 968 | 929 |
| 2017 | 853 | 896 | 930 | 981 | 1,040 | 1,063 | 1,027 | 991 | 933 | 878 | 986 | 948 |
| 2018 | 894 | 915 | 934 | 1,003 | 1,065 | 1,045 | 1,011 | 1,047 | 958 | 878 | 944 | 963 |
| 2019 | 933 | 878 | 841 | 957 | 1,010 | 1,015 | 1,043 | 1,039 | 1,002 | 957 | 948 | 952 |
| 2020 | 876 | 878 | 836 | 728 | 805 | 905 | 943 | 945 | 934 | 945 | 905 | 885 |
| 2021 | 872 | 686 | 890 | 936 | 1,035 | 1,051 | 1,021 | 1,038 | 970 | 980 | 1,001 | 946 |
| 2022 | 916 | 935 | 956 | 985 | 1,040 | 1,064 | 988 | 1,043 | 981 | 1,001 | 990 | 950 |
| 2023 | 918 | 943 | 906 | 930 | 956 | 1,035 | 1,026 | 975 | 890 | 915 | 984 | 935 |
| 2024 | 887 | |||||||||||
| - = No Data Reported; -- = Not Applicable; NA = Not Available; W = Withheld to avoid disclosure of individual company data. |
| Release Date: 3/29/2024 |
| Next Release Date: 4/30/2024 |