|
Download Data (XLS File) |
|
||||||||
|
||||||||
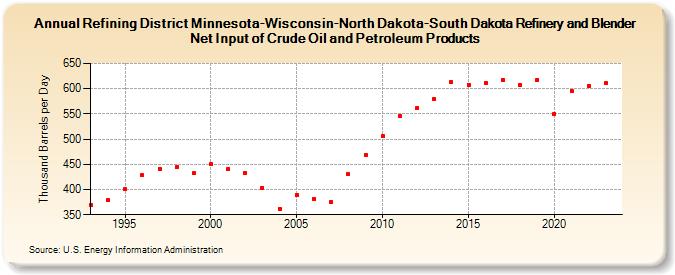
| Refining District Minnesota-Wisconsin-North Dakota-South Dakota Refinery and Blender Net Input of Crude Oil and Petroleum Products (Thousand Barrels per Day) | ||||||||
| Decade | Year-0 | Year-1 | Year-2 | Year-3 | Year-4 | Year-5 | Year-6 | Year-7 | Year-8 | Year-9 |
|---|---|---|---|---|---|---|---|---|---|---|
| 1990's | 369 | 379 | 401 | 428 | 441 | 444 | 432 | |||
| 2000's | 450 | 441 | 433 | 403 | 362 | 390 | 382 | 375 | 430 | 469 |
| 2010's | 506 | 545 | 561 | 580 | 613 | 608 | 612 | 618 | 608 | 618 |
| 2020's | 550 | 596 | 606 | 611 |
| - = No Data Reported; -- = Not Applicable; NA = Not Available; W = Withheld to avoid disclosure of individual company data. |
| Release Date: 3/29/2024 |
| Next Release Date: 8/30/2024 |