|
Download Data (XLS File) |
|
||||||||
|
||||||||
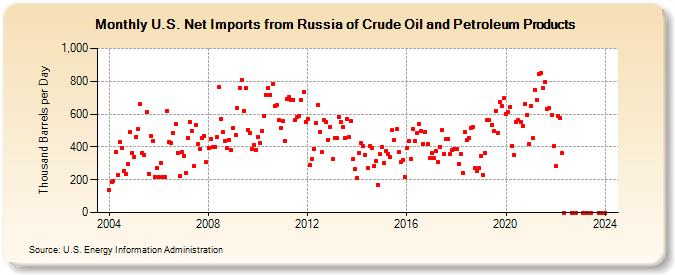
| U.S. Net Imports from Russia of Crude Oil and Petroleum Products (Thousand Barrels per Day) | ||||||||
| Year | Jan | Feb | Mar | Apr | May | Jun | Jul | Aug | Sep | Oct | Nov | Dec |
|---|---|---|---|---|---|---|---|---|---|---|---|---|
| 2004 | 136 | 184 | 194 | 371 | 226 | 432 | 396 | 256 | 234 | 295 | 490 | 364 |
| 2005 | 337 | 463 | 509 | 660 | 365 | 349 | 614 | 237 | 466 | 435 | 216 | 274 |
| 2006 | 218 | 304 | 214 | 219 | 621 | 430 | 425 | 485 | 537 | 365 | 223 | 369 |
| 2007 | 347 | 241 | 455 | 553 | 499 | 283 | 533 | 416 | 388 | 452 | 469 | 306 |
| 2008 | 392 | 448 | 400 | 402 | 460 | 764 | 572 | 489 | 433 | 393 | 445 | 382 |
| 2009 | 516 | 472 | 637 | 759 | 809 | 618 | 757 | 505 | 486 | 385 | 414 | 384 |
| 2010 | 463 | 423 | 494 | 587 | 719 | 759 | 719 | 786 | 647 | 654 | 561 | 514 |
| 2011 | 557 | 436 | 689 | 704 | 683 | 688 | 563 | 585 | 591 | 687 | 737 | 552 |
| 2012 | 572 | 287 | 326 | 388 | 547 | 654 | 490 | 368 | 561 | 552 | 445 | 523 |
| 2013 | 327 | 454 | 453 | 584 | 554 | 519 | 455 | 572 | 458 | 555 | 325 | 264 |
| 2014 | 212 | 364 | 424 | 404 | 351 | 274 | 405 | 394 | 282 | 316 | 170 | 355 |
| 2015 | 401 | 300 | 376 | 358 | 337 | 500 | 445 | 509 | 368 | 307 | 320 | 219 |
| 2016 | 395 | 436 | 329 | 509 | 435 | 485 | 538 | 498 | 420 | 491 | 419 | 334 |
| 2017 | 361 | 331 | 378 | 308 | 401 | 503 | 358 | 448 | 450 | 355 | 384 | 389 |
| 2018 | 385 | 296 | 356 | 243 | 491 | 439 | 454 | 515 | 519 | 271 | 254 | 271 |
| 2019 | 344 | 226 | 363 | 566 | 563 | 534 | 496 | 617 | 486 | 675 | 649 | 696 |
| 2020 | 601 | 614 | 645 | 408 | 350 | 551 | 563 | 552 | 527 | 660 | 597 | 416 |
| 2021 | 648 | 453 | 749 | 688 | 844 | 850 | 761 | 795 | 632 | 635 | 595 | 405 |
| 2022 | 282 | 586 | 575 | 360 | 0 | 0 | 0 | |||||
| 2023 | 0 | 0 | 0 | 0 | 0 | |||||||
| 2024 | 0 | |||||||||||
| - = No Data Reported; -- = Not Applicable; NA = Not Available; W = Withheld to avoid disclosure of individual company data. |
| Release Date: 3/29/2024 |
| Next Release Date: 4/30/2024 |