|
Download Data (XLS File) |
|
||||||||
|
||||||||
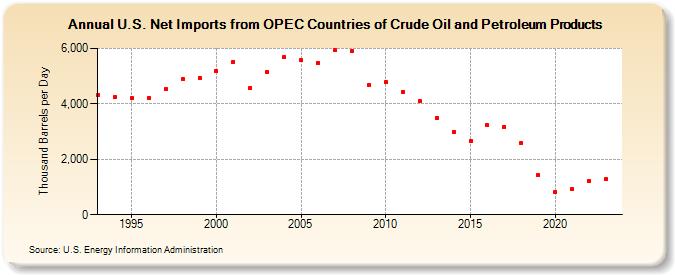
| U.S. Net Imports from OPEC Countries of Crude Oil and Petroleum Products (Thousand Barrels per Day) | ||||||||
| Decade | Year-0 | Year-1 | Year-2 | Year-3 | Year-4 | Year-5 | Year-6 | Year-7 | Year-8 | Year-9 |
|---|---|---|---|---|---|---|---|---|---|---|
| 1990's | 4,329 | 4,231 | 4,209 | 4,194 | 4,542 | 4,880 | 4,934 | |||
| 2000's | 5,181 | 5,509 | 4,588 | 5,144 | 5,688 | 5,567 | 5,480 | 5,946 | 5,899 | 4,675 |
| 2010's | 4,787 | 4,429 | 4,093 | 3,483 | 2,996 | 2,654 | 3,221 | 3,174 | 2,580 | 1,434 |
| 2020's | 828 | 914 | 1,215 | 1,285 |
| - = No Data Reported; -- = Not Applicable; NA = Not Available; W = Withheld to avoid disclosure of individual company data. |
| Release Date: 8/30/2024 |
| Next Release Date: 8/29/2025 |