|
Download Data (XLS File) |
|
||||||||
|
||||||||
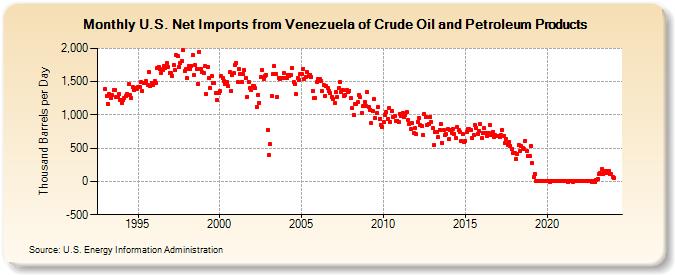
| U.S. Net Imports from Venezuela of Crude Oil and Petroleum Products (Thousand Barrels per Day) | ||||||||
| Year | Jan | Feb | Mar | Apr | May | Jun | Jul | Aug | Sep | Oct | Nov | Dec |
|---|---|---|---|---|---|---|---|---|---|---|---|---|
| 1993 | 1,389 | 1,291 | 1,170 | 1,310 | 1,260 | 1,292 | 1,377 | 1,375 | 1,272 | 1,272 | 1,316 | 1,225 |
| 1994 | 1,184 | 1,221 | 1,257 | 1,284 | 1,316 | 1,459 | 1,293 | 1,251 | 1,417 | 1,382 | 1,410 | 1,392 |
| 1995 | 1,423 | 1,424 | 1,490 | 1,358 | 1,473 | 1,478 | 1,505 | 1,447 | 1,648 | 1,431 | 1,485 | 1,452 |
| 1996 | 1,506 | 1,485 | 1,711 | 1,721 | 1,690 | 1,634 | 1,680 | 1,734 | 1,702 | 1,781 | 1,724 | 1,635 |
| 1997 | 1,633 | 1,590 | 1,754 | 1,669 | 1,904 | 1,881 | 1,724 | 1,786 | 1,806 | 1,974 | 1,667 | 1,685 |
| 1998 | 1,552 | 1,734 | 1,684 | 1,739 | 1,896 | 1,601 | 1,748 | 1,688 | 1,470 | 1,952 | 1,696 | 1,640 |
| 1999 | 1,630 | 1,735 | 1,316 | 1,717 | 1,558 | 1,407 | 1,586 | 1,474 | 1,480 | 1,336 | 1,217 | 1,330 |
| 2000 | 1,353 | 1,578 | 1,550 | 1,511 | 1,460 | 1,496 | 1,429 | 1,639 | 1,365 | 1,598 | 1,624 | 1,752 |
| 2001 | 1,777 | 1,489 | 1,688 | 1,609 | 1,495 | 1,614 | 1,674 | 1,561 | 1,275 | 1,502 | 1,407 | 1,371 |
| 2002 | 1,440 | 1,435 | 1,398 | 1,122 | 1,305 | 1,184 | 1,573 | 1,676 | 1,546 | 1,588 | 1,607 | 771 |
| 2003 | 403 | 558 | 1,284 | 1,614 | 1,735 | 1,620 | 1,271 | 1,559 | 1,539 | 1,552 | 1,558 | 1,623 |
| 2004 | 1,562 | 1,561 | 1,599 | 1,586 | 1,595 | 1,705 | 1,489 | 1,468 | 1,309 | 1,556 | 1,532 | 1,612 |
| 2005 | 1,613 | 1,691 | 1,539 | 1,577 | 1,645 | 1,587 | 1,605 | 1,574 | 1,364 | 1,247 | 1,250 | 1,497 |
| 2006 | 1,543 | 1,541 | 1,507 | 1,362 | 1,447 | 1,281 | 1,433 | 1,399 | 1,357 | 1,328 | 1,266 | 1,243 |
| 2007 | 1,178 | 1,345 | 1,268 | 1,402 | 1,492 | 1,340 | 1,377 | 1,284 | 1,297 | 1,373 | 1,351 | 1,367 |
| 2008 | 1,258 | 1,097 | 1,002 | 1,163 | 1,158 | 1,187 | 1,306 | 1,262 | 1,032 | 1,135 | 1,199 | 1,137 |
| 2009 | 1,338 | 1,116 | 1,081 | 873 | 1,064 | 1,238 | 952 | 1,036 | 1,122 | 944 | 856 | 824 |
| 2010 | 896 | 1,004 | 1,041 | 935 | 1,101 | 897 | 1,056 | 975 | 987 | 915 | 914 | 889 |
| 2011 | 1,015 | 977 | 1,035 | 970 | 998 | 1,047 | 930 | 868 | 786 | 872 | 735 | 797 |
| 2012 | 713 | 900 | 951 | 850 | 832 | 692 | 1,021 | 965 | 842 | 868 | 965 | 894 |
| 2013 | 801 | 541 | 743 | 738 | 666 | 780 | 869 | 582 | 776 | 696 | 711 | 783 |
| 2014 | 636 | 777 | 726 | 789 | 720 | 654 | 822 | 772 | 750 | 613 | 713 | 597 |
| 2015 | 613 | 748 | 786 | 784 | 779 | 659 | 700 | 846 | 806 | 717 | 751 | 861 |
| 2016 | 646 | 727 | 796 | 728 | 690 | 723 | 845 | 698 | 746 | 670 | 694 | 688 |
| 2017 | 681 | 674 | 699 | 774 | 688 | 573 | 631 | 552 | 598 | 540 | 484 | 431 |
| 2018 | 424 | 336 | 411 | 545 | 457 | 532 | 509 | 483 | 612 | 460 | 390 | 384 |
| 2019 | 540 | 279 | 69 | 114 | 10 | 0 | 0 | 0 | 0 | 0 | 0 | 0 |
| 2020 | 0 | 0 | -1 | 0 | 0 | 0 | 0 | 0 | 0 | 0 | 0 | 0 |
| 2021 | 0 | 0 | 0 | -1 | 0 | 0 | 0 | -1 | 0 | 0 | 0 | 0 |
| 2022 | 0 | 0 | 0 | 0 | 0 | 0 | 0 | 0 | 0 | -1 | 0 | -15 |
| 2023 | 25 | 42 | 109 | 125 | 184 | 111 | 153 | 130 | 162 | 151 | 111 | 109 |
| 2024 | 67 | |||||||||||
| - = No Data Reported; -- = Not Applicable; NA = Not Available; W = Withheld to avoid disclosure of individual company data. |
| Release Date: 3/29/2024 |
| Next Release Date: 4/30/2024 |