|
Download Data (XLS File) |
|
||||||||
|
||||||||
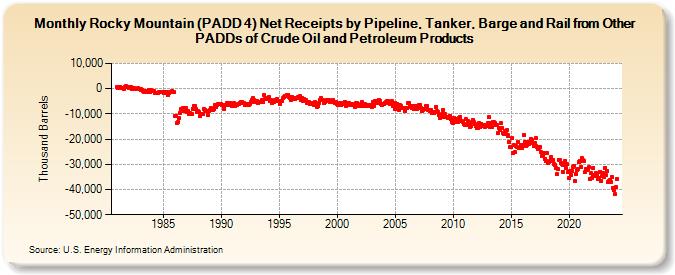
| Rocky Mountain (PADD 4) Net Receipts by Pipeline, Tanker, Barge and Rail from Other PADDs of Crude Oil and Petroleum Products (Thousand Barrels) | ||||||||
| Year | Jan | Feb | Mar | Apr | May | Jun | Jul | Aug | Sep | Oct | Nov | Dec |
|---|---|---|---|---|---|---|---|---|---|---|---|---|
| 1981 | 652 | 164 | 778 | 745 | 212 | 176 | 160 | 70 | 644 | 940 | 477 | 571 |
| 1982 | 414 | 770 | 739 | 37 | 259 | 87 | -16 | -308 | -239 | 149 | -219 | -1 |
| 1983 | -270 | -391 | -379 | -915 | -1,179 | -1,068 | -1,397 | -1,357 | -1,051 | -494 | -1,192 | -709 |
| 1984 | -740 | -926 | -1,034 | -1,572 | -1,692 | -1,891 | -1,671 | -1,469 | -1,422 | -1,388 | -1,505 | -1,412 |
| 1985 | -1,748 | -1,329 | -1,845 | -1,294 | -1,768 | -2,332 | -1,701 | -1,366 | -1,269 | -936 | -1,119 | -1,468 |
| 1986 | -10,945 | -10,763 | -13,540 | -13,075 | -11,808 | -9,503 | -8,207 | -8,089 | -7,744 | -8,932 | -7,498 | -7,556 |
| 1987 | -9,135 | -8,891 | -10,130 | -9,474 | -10,213 | -10,133 | -7,861 | -6,810 | -6,695 | -7,929 | -8,874 | -9,115 |
| 1988 | -9,004 | -9,422 | -10,995 | -10,239 | -9,980 | -10,092 | -8,242 | -8,285 | -8,781 | -9,000 | -10,246 | -8,733 |
| 1989 | -8,603 | -7,678 | -8,525 | -8,354 | -7,968 | -6,469 | -7,191 | -6,315 | -6,110 | -6,196 | -5,902 | -5,892 |
| 1990 | -6,300 | -6,364 | -7,609 | -7,899 | -6,645 | -6,597 | -5,630 | -6,586 | -5,945 | -5,624 | -6,383 | -6,971 |
| 1991 | -6,627 | -5,695 | -6,774 | -6,424 | -6,624 | -6,196 | -5,987 | -5,607 | -5,102 | -5,091 | -5,490 | -5,753 |
| 1992 | -6,387 | -6,586 | -6,053 | -6,616 | -6,449 | -5,952 | -5,284 | -4,362 | -4,544 | -3,825 | -4,545 | -5,420 |
| 1993 | -5,471 | -4,991 | -5,822 | -5,377 | -5,461 | -5,431 | -4,616 | -5,139 | -2,627 | -4,288 | -4,149 | -3,800 |
| 1994 | -4,286 | -3,305 | -4,929 | -4,370 | -5,825 | -5,127 | -5,230 | -4,670 | -4,374 | -4,225 | -4,861 | -4,859 |
| 1995 | -5,911 | -4,715 | -5,017 | -4,840 | -3,835 | -3,357 | -3,099 | -2,968 | -2,443 | -2,343 | -3,109 | -3,512 |
| 1996 | -4,343 | -3,160 | -3,892 | -4,062 | -4,003 | -3,634 | -3,863 | -3,417 | -3,405 | -3,039 | -4,301 | -3,526 |
| 1997 | -4,690 | -4,034 | -4,383 | -4,302 | -5,625 | -5,828 | -5,252 | -6,202 | -5,884 | -5,845 | -5,481 | -5,757 |
| 1998 | -6,608 | -5,472 | -6,291 | -7,317 | -7,002 | -5,637 | -4,572 | -3,719 | -4,343 | -4,604 | -5,690 | -5,323 |
| 1999 | -4,843 | -4,443 | -4,865 | -4,371 | -5,135 | -5,250 | -4,971 | -4,542 | -5,464 | -5,778 | -5,444 | -6,197 |
| 2000 | -6,274 | -6,451 | -6,339 | -5,700 | -6,285 | -6,054 | -5,849 | -6,031 | -5,314 | -6,715 | -5,701 | -5,490 |
| 2001 | -5,668 | -6,359 | -6,487 | -6,017 | -6,371 | -6,392 | -7,422 | -5,843 | -5,551 | -6,251 | -6,822 | -6,922 |
| 2002 | -6,483 | -5,197 | -6,808 | -6,712 | -5,887 | -6,359 | -6,318 | -6,786 | -6,358 | -6,324 | -6,542 | -7,059 |
| 2003 | -7,154 | -5,106 | -6,815 | -4,856 | -5,500 | -5,557 | -5,003 | -4,314 | -4,842 | -6,015 | -6,631 | -6,143 |
| 2004 | -6,163 | -5,512 | -5,479 | -4,815 | -4,969 | -5,571 | -6,105 | -5,095 | -5,004 | -6,712 | -6,965 | -5,800 |
| 2005 | -7,988 | -7,079 | -6,035 | -6,737 | -8,371 | -6,635 | -6,980 | -7,617 | -7,671 | -7,801 | -8,655 | -7,545 |
| 2006 | -7,553 | -5,638 | -5,778 | -6,677 | -7,169 | -7,551 | -6,742 | -8,019 | -7,019 | -7,058 | -7,935 | -7,415 |
| 2007 | -6,538 | -6,334 | -7,683 | -8,945 | -8,365 | -8,451 | -7,989 | -8,192 | -6,720 | -6,915 | -8,299 | -8,430 |
| 2008 | -8,973 | -8,465 | -9,538 | -9,407 | -9,537 | -9,345 | -7,263 | -8,799 | -9,215 | -10,340 | -11,653 | -10,454 |
| 2009 | -10,172 | -8,649 | -11,118 | -10,068 | -11,209 | -11,143 | -11,591 | -11,332 | -10,793 | -12,045 | -11,841 | -13,226 |
| 2010 | -13,608 | -11,569 | -13,003 | -12,016 | -13,406 | -13,094 | -11,665 | -11,186 | -12,824 | -12,927 | -13,364 | -13,984 |
| 2011 | -14,294 | -12,140 | -14,402 | -12,809 | -14,466 | -15,016 | -14,675 | -13,288 | -12,328 | -13,235 | -14,200 | -14,830 |
| 2012 | -15,533 | -15,442 | -15,288 | -13,558 | -15,111 | -13,878 | -14,886 | -14,866 | -14,377 | -15,033 | -14,862 | -14,610 |
| 2013 | -13,678 | -11,336 | -15,095 | -13,585 | -15,089 | -13,377 | -13,403 | -13,563 | -14,602 | -14,504 | -17,611 | -15,766 |
| 2014 | -16,563 | -13,723 | -15,513 | -17,464 | -17,857 | -16,917 | -17,857 | -16,542 | -18,325 | -18,928 | -21,216 | -23,114 |
| 2015 | -23,307 | -19,756 | -25,492 | -22,527 | -25,219 | -22,838 | -23,179 | -21,188 | -23,464 | -23,683 | -22,217 | -23,340 |
| 2016 | -22,359 | -18,397 | -21,246 | -22,912 | -22,336 | -21,133 | -21,844 | -21,590 | -20,001 | -20,380 | -21,722 | -22,856 |
| 2017 | -21,551 | -19,734 | -22,782 | -23,243 | -24,081 | -23,405 | -23,221 | -25,146 | -26,601 | -26,457 | -25,677 | -27,960 |
| 2018 | -28,548 | -25,534 | -29,350 | -29,076 | -28,691 | -27,022 | -28,460 | -28,258 | -29,851 | -30,117 | -31,281 | -33,955 |
| 2019 | -31,957 | -28,142 | -28,355 | -29,366 | -29,700 | -32,906 | -30,371 | -29,297 | -28,725 | -31,468 | -30,056 | -32,927 |
| 2020 | -35,613 | -32,675 | -34,385 | -32,663 | -30,893 | -30,664 | -36,625 | -33,879 | -32,436 | -31,777 | -29,136 | -28,576 |
| 2021 | -31,038 | -27,669 | -28,450 | -28,685 | -33,219 | -31,781 | -32,327 | -31,684 | -31,129 | -35,762 | -33,566 | -35,581 |
| 2022 | -34,305 | -31,319 | -34,651 | -34,633 | -33,461 | -34,092 | -35,716 | -35,347 | -32,891 | -36,607 | -34,758 | -33,567 |
| 2023 | -35,027 | -31,346 | -34,329 | -32,839 | -36,824 | -36,433 | -36,186 | -37,206 | -34,966 | -39,441 | -40,260 | -41,942 |
| 2024 | -38,940 | |||||||||||
| - = No Data Reported; -- = Not Applicable; NA = Not Available; W = Withheld to avoid disclosure of individual company data. |
| Release Date: 3/29/2024 |
| Next Release Date: 4/30/2024 |