|
Download Data (XLS File) |
|
||||||||
|
||||||||
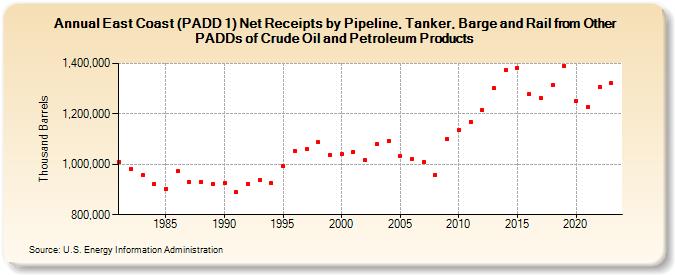
| East Coast (PADD 1) Net Receipts by Pipeline, Tanker, Barge and Rail from Other PADDs of Crude Oil and Petroleum Products (Thousand Barrels) | ||||||||
| Decade | Year-0 | Year-1 | Year-2 | Year-3 | Year-4 | Year-5 | Year-6 | Year-7 | Year-8 | Year-9 |
|---|---|---|---|---|---|---|---|---|---|---|
| 1980's | 1,010,125 | 980,991 | 957,484 | 923,597 | 903,850 | 972,607 | 930,662 | 931,115 | 922,385 | |
| 1990's | 926,438 | 888,712 | 923,800 | 938,069 | 925,706 | 991,491 | 1,054,534 | 1,059,664 | 1,086,883 | 1,037,467 |
| 2000's | 1,039,689 | 1,050,615 | 1,016,317 | 1,079,671 | 1,094,063 | 1,031,466 | 1,021,272 | 1,009,989 | 959,458 | 1,099,509 |
| 2010's | 1,136,386 | 1,169,527 | 1,214,880 | 1,301,275 | 1,374,621 | 1,383,362 | 1,278,868 | 1,261,173 | 1,313,056 | 1,391,346 |
| 2020's | 1,251,174 | 1,228,703 | 1,306,078 | 1,322,981 |
| - = No Data Reported; -- = Not Applicable; NA = Not Available; W = Withheld to avoid disclosure of individual company data. |
| Release Date: 3/29/2024 |
| Next Release Date: 8/30/2024 |