|
Download Data (XLS File) |
|
||||||||
|
||||||||
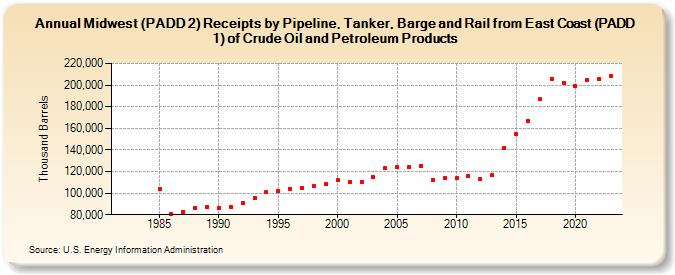
| Midwest (PADD 2) Receipts by Pipeline, Tanker, Barge and Rail from East Coast (PADD 1) of Crude Oil and Petroleum Products (Thousand Barrels) | ||||||||
| Decade | Year-0 | Year-1 | Year-2 | Year-3 | Year-4 | Year-5 | Year-6 | Year-7 | Year-8 | Year-9 |
|---|---|---|---|---|---|---|---|---|---|---|
| 1980's | NA | NA | NA | NA | 103,937 | 80,502 | 82,695 | 86,140 | 87,576 | |
| 1990's | 86,574 | 87,112 | 91,200 | 95,629 | 100,616 | 101,544 | 104,151 | 105,084 | 106,718 | 108,832 |
| 2000's | 111,694 | 110,306 | 110,481 | 114,839 | 123,232 | 123,815 | 123,844 | 125,514 | 111,786 | 113,994 |
| 2010's | 113,532 | 115,485 | 113,361 | 116,611 | 142,033 | 154,417 | 166,919 | 186,685 | 205,853 | 202,349 |
| 2020's | 199,042 | 204,622 | 205,648 | 208,717 |
| - = No Data Reported; -- = Not Applicable; NA = Not Available; W = Withheld to avoid disclosure of individual company data. |
| Release Date: 3/29/2024 |
| Next Release Date: 8/30/2024 |