|
Download Data (XLS File) |
|
||||||||
|
||||||||
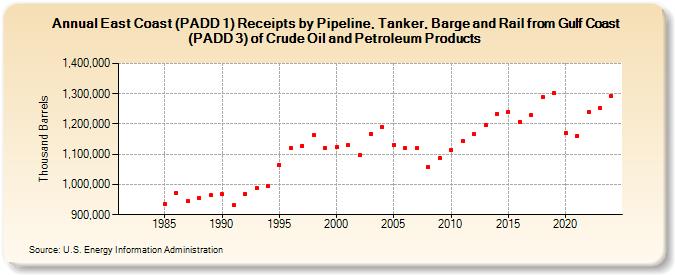
| East Coast (PADD 1) Receipts by Pipeline, Tanker, Barge and Rail from Gulf Coast (PADD 3) of Crude Oil and Petroleum Products (Thousand Barrels) | ||||||||
| Decade | Year-0 | Year-1 | Year-2 | Year-3 | Year-4 | Year-5 | Year-6 | Year-7 | Year-8 | Year-9 |
|---|---|---|---|---|---|---|---|---|---|---|
| 1980's | NA | NA | NA | NA | 935,150 | 972,224 | 945,060 | 956,117 | 965,026 | |
| 1990's | 966,855 | 930,712 | 968,016 | 988,647 | 994,108 | 1,064,180 | 1,122,126 | 1,128,654 | 1,163,343 | 1,120,643 |
| 2000's | 1,122,646 | 1,129,232 | 1,096,368 | 1,166,880 | 1,189,909 | 1,131,520 | 1,121,321 | 1,120,071 | 1,056,991 | 1,087,400 |
| 2010's | 1,113,640 | 1,142,537 | 1,166,611 | 1,196,288 | 1,233,674 | 1,239,856 | 1,207,407 | 1,229,925 | 1,287,735 | 1,302,191 |
| 2020's | 1,170,013 | 1,161,098 | 1,241,053 | 1,252,193 |
| - = No Data Reported; -- = Not Applicable; NA = Not Available; W = Withheld to avoid disclosure of individual company data. |
| Release Date: 3/29/2024 |
| Next Release Date: 8/30/2024 |