|
Download Data (XLS File) |
|
||||||||
|
||||||||
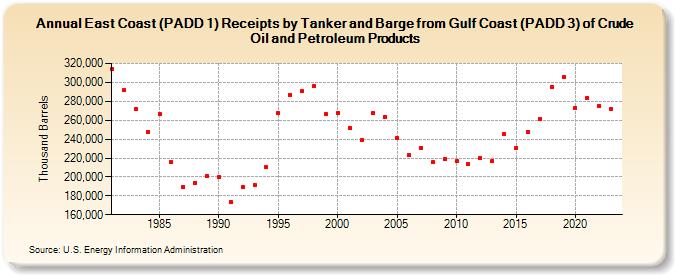
| East Coast (PADD 1) Receipts by Tanker and Barge from Gulf Coast (PADD 3) of Crude Oil and Petroleum Products (Thousand Barrels) | ||||||||
| Decade | Year-0 | Year-1 | Year-2 | Year-3 | Year-4 | Year-5 | Year-6 | Year-7 | Year-8 | Year-9 |
|---|---|---|---|---|---|---|---|---|---|---|
| 1980's | 314,335 | 291,629 | 271,834 | 247,837 | 266,672 | 215,371 | 189,486 | 193,836 | 200,921 | |
| 1990's | 199,768 | 173,329 | 189,353 | 191,207 | 210,190 | 267,429 | 287,032 | 290,642 | 295,879 | 266,266 |
| 2000's | 267,869 | 252,138 | 238,871 | 267,302 | 262,957 | 241,324 | 223,423 | 230,588 | 215,417 | 218,929 |
| 2010's | 216,441 | 213,762 | 220,029 | 216,945 | 244,955 | 230,174 | 247,605 | 261,765 | 294,984 | 305,196 |
| 2020's | 272,784 | 283,707 | 275,334 | 271,845 |
| - = No Data Reported; -- = Not Applicable; NA = Not Available; W = Withheld to avoid disclosure of individual company data. |
| Release Date: 8/30/2024 |
| Next Release Date: 8/29/2025 |