|
Download Data (XLS File) |
|
||||||||
|
||||||||
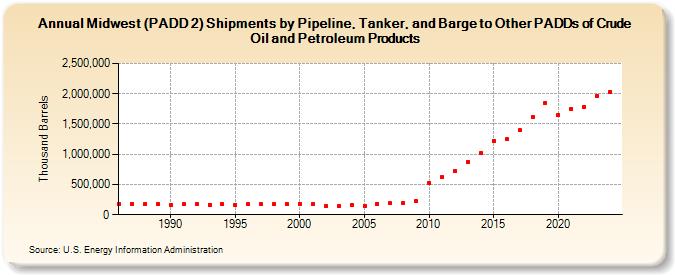
| Midwest (PADD 2) Shipments by Pipeline, Tanker, and Barge to Other PADDs of Crude Oil and Petroleum Products (Thousand Barrels) | ||||||||
| Decade | Year-0 | Year-1 | Year-2 | Year-3 | Year-4 | Year-5 | Year-6 | Year-7 | Year-8 | Year-9 |
|---|---|---|---|---|---|---|---|---|---|---|
| 1980's | 173,240 | 185,252 | 172,900 | 169,294 | ||||||
| 1990's | 167,487 | 172,499 | 172,089 | 166,912 | 176,399 | 163,981 | 170,578 | 172,262 | 170,389 | 172,318 |
| 2000's | 183,655 | 176,830 | 142,454 | 135,885 | 159,836 | 150,190 | 183,981 | 188,927 | 201,393 | 220,262 |
| 2010's | 523,906 | 620,819 | 721,330 | 878,757 | 1,018,615 | 1,219,230 | 1,245,442 | 1,397,476 | 1,613,289 | 1,849,435 |
| 2020's | 1,649,349 | 1,749,652 | 1,783,729 | 1,969,725 |
| - = No Data Reported; -- = Not Applicable; NA = Not Available; W = Withheld to avoid disclosure of individual company data. |
| Release Date: 8/30/2024 |
| Next Release Date: 8/29/2025 |
Referring Pages: