|
Download Data (XLS File) |
|
||||||||
|
||||||||
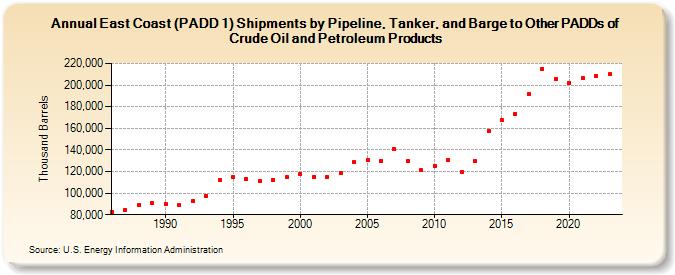
| East Coast (PADD 1) Shipments by Pipeline, Tanker, and Barge to Other PADDs of Crude Oil and Petroleum Products (Thousand Barrels) | ||||||||
| Decade | Year-0 | Year-1 | Year-2 | Year-3 | Year-4 | Year-5 | Year-6 | Year-7 | Year-8 | Year-9 |
|---|---|---|---|---|---|---|---|---|---|---|
| 1980's | 82,804 | 84,675 | 89,144 | 90,560 | ||||||
| 1990's | 89,589 | 88,704 | 92,380 | 97,593 | 111,761 | 114,966 | 113,273 | 111,322 | 112,320 | 114,670 |
| 2000's | 118,130 | 115,224 | 115,042 | 118,776 | 128,482 | 130,522 | 129,735 | 140,420 | 129,935 | 121,139 |
| 2010's | 125,500 | 130,535 | 119,930 | 129,866 | 157,784 | 167,384 | 173,342 | 191,713 | 215,015 | 205,705 |
| 2020's | 202,246 | 206,521 | 208,291 | 209,982 |
| - = No Data Reported; -- = Not Applicable; NA = Not Available; W = Withheld to avoid disclosure of individual company data. |
| Release Date: 3/29/2024 |
| Next Release Date: 8/30/2024 |
Referring Pages: