|
Download Data (XLS File) |
|
||||||||
|
||||||||
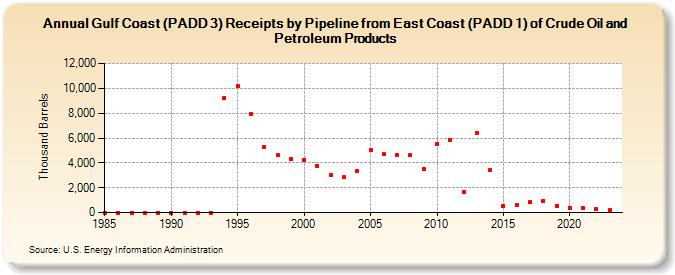
| Gulf Coast (PADD 3) Receipts by Pipeline from East Coast (PADD 1) of Crude Oil and Petroleum Products (Thousand Barrels) | ||||||||
| Decade | Year-0 | Year-1 | Year-2 | Year-3 | Year-4 | Year-5 | Year-6 | Year-7 | Year-8 | Year-9 |
|---|---|---|---|---|---|---|---|---|---|---|
| 1980's | 0 | 0 | 0 | 0 | 0 | |||||
| 1990's | 0 | 0 | 0 | 0 | 9,260 | 10,186 | 7,944 | 5,257 | 4,667 | 4,282 |
| 2000's | 4,235 | 3,713 | 3,043 | 2,831 | 3,380 | 5,002 | 4,712 | 4,637 | 4,620 | 3,527 |
| 2010's | 5,488 | 5,852 | 1,689 | 6,405 | 3,400 | 546 | 571 | 884 | 947 | 522 |
| 2020's | 372 | 360 | 276 | 223 |
| - = No Data Reported; -- = Not Applicable; NA = Not Available; W = Withheld to avoid disclosure of individual company data. |
| Release Date: 8/30/2024 |
| Next Release Date: 8/29/2025 |