|
Download Data (XLS File) |
|
||||||||
|
||||||||
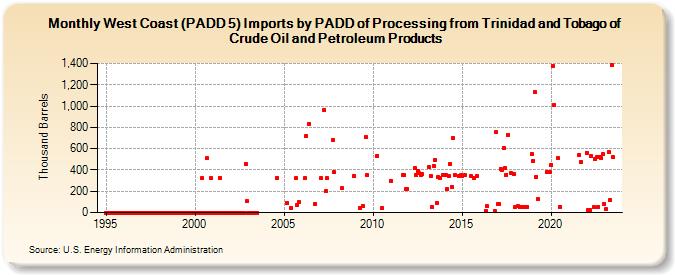
| West Coast (PADD 5) Imports by PADD of Processing from Trinidad and Tobago of Crude Oil and Petroleum Products (Thousand Barrels) | ||||||||
| Year | Jan | Feb | Mar | Apr | May | Jun | Jul | Aug | Sep | Oct | Nov | Dec |
|---|---|---|---|---|---|---|---|---|---|---|---|---|
| 1995 | 0 | 0 | 0 | 0 | 0 | 0 | 0 | 0 | 0 | 0 | 0 | 0 |
| 1996 | 0 | 0 | 0 | 0 | 0 | 0 | 0 | 0 | 0 | 0 | 0 | 0 |
| 1997 | 0 | 0 | 0 | 0 | 0 | 0 | 0 | 0 | 0 | 0 | 0 | 0 |
| 1998 | 0 | 0 | 0 | 0 | 0 | 0 | 0 | 0 | 0 | 0 | 0 | 0 |
| 1999 | 0 | 0 | 0 | 0 | 0 | 0 | 0 | 0 | 0 | 0 | 0 | 0 |
| 2000 | 0 | 0 | 0 | 0 | 0 | 320 | 0 | 0 | 510 | 0 | 0 | 320 |
| 2001 | 0 | 0 | 0 | 0 | 0 | 323 | 0 | 0 | 0 | 0 | 0 | 0 |
| 2002 | 0 | 0 | 0 | 0 | 0 | 0 | 0 | 0 | 0 | 0 | 460 | 105 |
| 2003 | 0 | 0 | 0 | 0 | 0 | 0 | 0 | |||||
| 2004 | 323 | |||||||||||
| 2005 | 90 | 45 | 320 | 74 | 98 | |||||||
| 2006 | 321 | 720 | 834 | 85 | ||||||||
| 2007 | 321 | 962 | 200 | 320 | 682 | 378 | ||||||
| 2008 | 226 | 346 | ||||||||||
| 2009 | 40 | 63 | 710 | 350 | ||||||||
| 2010 | 535 | 45 | ||||||||||
| 2011 | 300 | 352 | 350 | 220 | 221 | |||||||
| 2012 | 417 | 350 | 386 | 368 | 351 | 359 | ||||||
| 2013 | 424 | 344 | 54 | 439 | 496 | 91 | 336 | 323 | 355 | |||
| 2014 | 350 | 351 | 220 | 345 | 458 | 241 | 702 | 350 | 346 | 350 | ||
| 2015 | 348 | 350 | 340 | 328 | 340 | |||||||
| 2016 | 19 | 59 | 10 | 754 | ||||||||
| 2017 | 79 | 78 | 409 | 404 | 609 | 417 | 356 | 732 | 375 | 360 | ||
| 2018 | 55 | 57 | 55 | 55 | 55 | 55 | 55 | 551 | ||||
| 2019 | 486 | 1,128 | 337 | 126 | 380 | 381 | 381 | |||||
| 2020 | 451 | 1,378 | 1,011 | 510 | 56 | |||||||
| 2021 | 545 | 476 | ||||||||||
| 2022 | 564 | 24 | 24 | 527 | 48 | 500 | 525 | 56 | 522 | 510 | 547 | |
| 2023 | 80 | 31 | 565 | 118 | 1,385 | 518 | ||||||
| - = No Data Reported; -- = Not Applicable; NA = Not Available; W = Withheld to avoid disclosure of individual company data. |
| Release Date: 3/29/2024 |
| Next Release Date: 4/30/2024 |