|
Download Data (XLS File) |
|
||||||||
|
||||||||
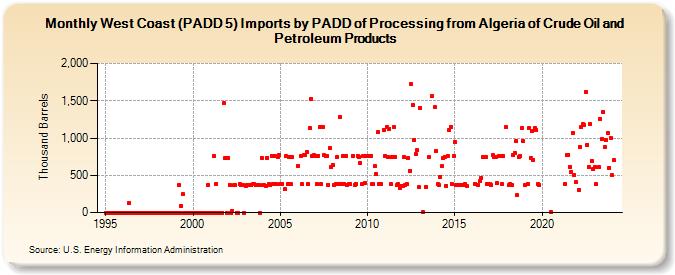
| West Coast (PADD 5) Imports by PADD of Processing from Algeria of Crude Oil and Petroleum Products (Thousand Barrels) | ||||||||
| Year | Jan | Feb | Mar | Apr | May | Jun | Jul | Aug | Sep | Oct | Nov | Dec |
|---|---|---|---|---|---|---|---|---|---|---|---|---|
| 1995 | 0 | 0 | 0 | 0 | 0 | 0 | 0 | 0 | 0 | 0 | 0 | 0 |
| 1996 | 0 | 0 | 0 | 0 | 130 | 0 | 0 | 0 | 0 | 0 | 0 | 0 |
| 1997 | 0 | 0 | 0 | 0 | 0 | 0 | 0 | 0 | 0 | 0 | 0 | 0 |
| 1998 | 0 | 0 | 0 | 0 | 0 | 0 | 0 | 0 | 0 | 0 | 0 | 0 |
| 1999 | 0 | 0 | 364 | 0 | 88 | 245 | 0 | 0 | 0 | 0 | 0 | 0 |
| 2000 | 0 | 0 | 0 | 0 | 0 | 0 | 0 | 0 | 0 | 0 | 373 | 0 |
| 2001 | 0 | 0 | 756 | 0 | 388 | 0 | 0 | 0 | 0 | 1,464 | 729 | 0 |
| 2002 | 734 | 376 | 0 | 27 | 366 | 369 | 0 | 0 | 379 | 367 | 364 | 0 |
| 2003 | 361 | 366 | 364 | 364 | 366 | 380 | 380 | 366 | 365 | 368 | 0 | 736 |
| 2004 | 373 | 364 | 357 | 737 | 383 | 369 | 765 | 382 | 756 | 377 | 746 | 769 |
| 2005 | 384 | 388 | 311 | 764 | 381 | 750 | 381 | 743 | ||||
| 2006 | 629 | 762 | 377 | 766 | 766 | 817 | 381 | 1,135 | 1,525 | 760 | 767 | |
| 2007 | 754 | 381 | 764 | 1,146 | 383 | 1,146 | 767 | 760 | 760 | 371 | 863 | 616 |
| 2008 | 644 | 376 | 378 | 744 | 384 | 1,284 | 382 | 764 | 382 | 753 | 375 | 381 |
| 2009 | 381 | 763 | 374 | 387 | 764 | 740 | 666 | 379 | 764 | 395 | 762 | |
| 2010 | 759 | 761 | 756 | 378 | 379 | 621 | 513 | 1,077 | 382 | 378 | 1,108 | |
| 2011 | 758 | 1,144 | 740 | 1,127 | 378 | 744 | 1,147 | 746 | 365 | 380 | 335 | 362 |
| 2012 | 362 | 747 | 365 | 379 | 730 | 562 | 1,719 | 1,446 | 972 | 781 | 833 | 340 |
| 2013 | 1,408 | 2 | 344 | 744 | 1,559 | 1,412 | 829 | |||||
| 2014 | 379 | 370 | 483 | 619 | 729 | 746 | 361 | 757 | 1,102 | 1,146 | 382 | 756 |
| 2015 | 948 | 372 | 375 | 376 | 371 | 382 | 362 | |||||
| 2016 | 382 | 373 | 417 | 464 | 743 | 747 | 746 | 383 | 386 | |||
| 2017 | 377 | 373 | 768 | 748 | 748 | 391 | 758 | 763 | 380 | 765 | 1,146 | |
| 2018 | 364 | 384 | 375 | 767 | 801 | 959 | 232 | 751 | 759 | 1,136 | 955 | |
| 2019 | 368 | 378 | 1,130 | 738 | 1,090 | 708 | 1,133 | 1,110 | 379 | 370 | ||
| 2020 | 13 | |||||||||||
| 2021 | 385 | 766 | 777 | 615 | 549 | 1,068 | 504 | 408 | ||||
| 2022 | 300 | 885 | 1,152 | 1,186 | 1,180 | 1,620 | 913 | 612 | 1,187 | 696 | 578 | |
| 2023 | 610 | 378 | 610 | 1,255 | 987 | 1,350 | 880 | 980 | 1,072 | 601 | 1,003 | |
| 2024 | 500 | 699 | ||||||||||
| - = No Data Reported; -- = Not Applicable; NA = Not Available; W = Withheld to avoid disclosure of individual company data. |
| Release Date: 4/30/2024 |
| Next Release Date: 5/31/2024 |