|
Download Data (XLS File) |
|
||||||||
|
||||||||
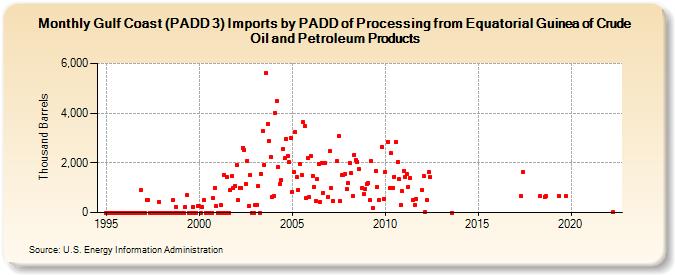
| Gulf Coast (PADD 3) Imports by PADD of Processing from Equatorial Guinea of Crude Oil and Petroleum Products (Thousand Barrels) | ||||||||
| Year | Jan | Feb | Mar | Apr | May | Jun | Jul | Aug | Sep | Oct | Nov | Dec |
|---|---|---|---|---|---|---|---|---|---|---|---|---|
| 1995 | 0 | 0 | 0 | 0 | 0 | 0 | 0 | 0 | 0 | 0 | 0 | 0 |
| 1996 | 0 | 0 | 0 | 0 | 0 | 0 | 0 | 0 | 0 | 0 | 888 | 0 |
| 1997 | 0 | 0 | 520 | 519 | 0 | 0 | 0 | 0 | 0 | 0 | 425 | 0 |
| 1998 | 0 | 0 | 0 | 0 | 0 | 0 | 0 | 491 | 0 | 241 | 0 | 0 |
| 1999 | 0 | 0 | 0 | 226 | 698 | 0 | 0 | 0 | 236 | 0 | 0 | 253 |
| 2000 | 246 | 0 | 224 | 491 | 0 | 0 | 0 | 0 | 0 | 568 | 1,008 | 262 |
| 2001 | 0 | 0 | 297 | 0 | 1,509 | 0 | 1,429 | 0 | 900 | 1,459 | 983 | 1,087 |
| 2002 | 1,919 | 501 | 994 | 997 | 2,609 | 2,537 | 1,164 | 2,095 | 275 | 1,521 | 0 | 0 |
| 2003 | 319 | 324 | 1,061 | 0 | 1,567 | 3,266 | 1,933 | 5,609 | 3,569 | 2,885 | 2,231 | 628 |
| 2004 | 660 | 4,010 | 4,494 | 1,830 | 1,145 | 1,301 | 2,565 | 2,184 | 2,964 | 2,270 | 2,023 | 3,004 |
| 2005 | 827 | 1,628 | 3,241 | 1,451 | 909 | 1,949 | 1,519 | 3,627 | 3,486 | 566 | 2,180 | 626 |
| 2006 | 2,269 | 1,474 | 1,047 | 484 | 1,336 | 1,956 | 426 | 1,995 | 798 | 2,000 | 638 | |
| 2007 | 2,463 | 992 | 472 | 2,067 | 3,080 | 459 | 1,520 | 1,523 | 1,533 | 957 | ||
| 2008 | 1,189 | 1,992 | 1,579 | 663 | 2,332 | 2,132 | 2,051 | 1,736 | 997 | 732 | 962 | |
| 2009 | 1,134 | 1,184 | 502 | 2,070 | 200 | 1,658 | 1,044 | 500 | 2,641 | 540 | ||
| 2010 | 1,642 | 2,851 | 997 | 2,385 | 994 | 1,449 | 2,834 | 2,047 | 1,333 | 314 | 852 | |
| 2011 | 1,675 | 1,445 | 1,545 | 1,033 | 1,381 | 514 | 299 | 546 | ||||
| 2012 | 917 | 1,455 | 29 | 518 | 1,626 | 1,424 | ||||||
| 2013 | 1 | |||||||||||
| 2017 | 647 | 1,634 | ||||||||||
| 2018 | 649 | 645 | 649 | |||||||||
| 2019 | 663 | 663 | ||||||||||
| 2022 | 16 | |||||||||||
| - = No Data Reported; -- = Not Applicable; NA = Not Available; W = Withheld to avoid disclosure of individual company data. |
| Release Date: 3/29/2024 |
| Next Release Date: 4/30/2024 |