|
Download Data (XLS File) |
|
||||||||
|
||||||||
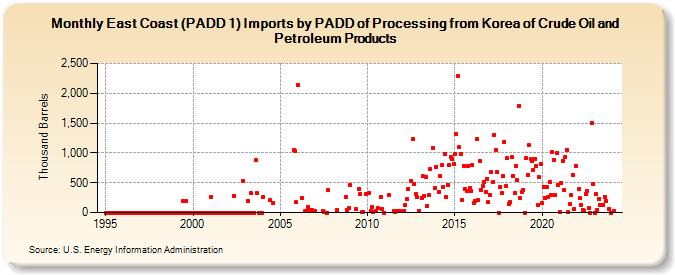
| East Coast (PADD 1) Imports by PADD of Processing from Korea of Crude Oil and Petroleum Products (Thousand Barrels) | ||||||||
| Year | Jan | Feb | Mar | Apr | May | Jun | Jul | Aug | Sep | Oct | Nov | Dec |
|---|---|---|---|---|---|---|---|---|---|---|---|---|
| 1995 | 0 | 0 | 0 | 0 | 0 | 0 | 0 | 0 | 0 | 0 | 0 | 0 |
| 1996 | 0 | 0 | 0 | 0 | 0 | 0 | 0 | 0 | 0 | 0 | 0 | 0 |
| 1997 | 0 | 0 | 0 | 0 | 0 | 0 | 0 | 0 | 0 | 0 | 0 | 0 |
| 1998 | 0 | 0 | 0 | 0 | 0 | 0 | 0 | 0 | 0 | 0 | 0 | 0 |
| 1999 | 0 | 0 | 0 | 0 | 0 | 198 | 0 | 201 | 0 | 0 | 0 | 0 |
| 2000 | 0 | 0 | 0 | 0 | 0 | 0 | 0 | 0 | 0 | 0 | 0 | 0 |
| 2001 | 264 | 0 | 0 | 0 | 0 | 0 | 0 | 0 | 0 | 0 | 0 | 0 |
| 2002 | 0 | 0 | 0 | 0 | 280 | 0 | 0 | 0 | 0 | 0 | 530 | 0 |
| 2003 | 0 | 0 | 193 | 0 | 320 | 0 | 0 | 877 | 320 | 0 | 0 | 0 |
| 2004 | 265 | 212 | 165 | |||||||||
| 2005 | 1,053 | 1,034 | 172 | |||||||||
| 2006 | 2,135 | 249 | 23 | 32 | 95 | 27 | 35 | 43 | ||||
| 2007 | 23 | 32 | 2 | 1 | 375 | |||||||
| 2008 | 50 | 264 | 38 | 70 | ||||||||
| 2009 | 454 | 56 | 388 | 319 | 3 | 10 | 311 | |||||
| 2010 | 332 | 25 | 85 | 10 | 20 | 75 | 267 | 56 | 1 | |||
| 2011 | 294 | 33 | 3 | 31 | 26 | |||||||
| 2012 | 28 | 122 | 228 | 402 | 534 | 1,236 | 476 | 313 | 253 | 28 | ||
| 2013 | 249 | 612 | 280 | 595 | 112 | 296 | 731 | 1,081 | 408 | 761 | ||
| 2014 | 345 | 606 | 791 | 437 | 990 | 262 | 470 | 792 | 927 | 894 | 806 | |
| 2015 | 974 | 1,315 | 2,282 | 1,095 | 977 | 213 | 786 | 393 | 367 | 784 | 411 | 360 |
| 2016 | 791 | 154 | 198 | 1,235 | 214 | 869 | 379 | 440 | 506 | 346 | 566 | 173 |
| 2017 | 297 | 687 | 520 | 1,309 | 1,052 | 672 | 1 | 422 | 323 | 612 | 1,191 | 444 |
| 2018 | 907 | 150 | 174 | 929 | 610 | 321 | 789 | 539 | 1,790 | 252 | 338 | 385 |
| 2019 | 1 | 922 | 635 | 1,125 | 899 | 866 | 718 | 901 | 777 | 121 | 592 | 820 |
| 2020 | 168 | 422 | 248 | 430 | 256 | 518 | 298 | 1,017 | 882 | 289 | 1,007 | 460 |
| 2021 | 8 | 499 | 872 | 376 | 935 | 1,054 | 7 | 151 | 293 | 634 | 56 | 781 |
| 2022 | 388 | 239 | 120 | 39 | 23 | 313 | 364 | 69 | 1 | 1,508 | 475 | |
| 2023 | 1 | 315 | 47 | 232 | 135 | 129 | 266 | 191 | 60 | 1 | ||
| - = No Data Reported; -- = Not Applicable; NA = Not Available; W = Withheld to avoid disclosure of individual company data. |
| Release Date: 3/29/2024 |
| Next Release Date: 4/30/2024 |