|
Download Data (XLS File) |
|
||||||||
|
||||||||
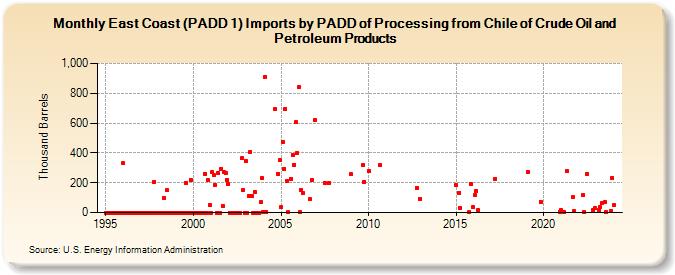
| East Coast (PADD 1) Imports by PADD of Processing from Chile of Crude Oil and Petroleum Products (Thousand Barrels) | ||||||||
| Year | Jan | Feb | Mar | Apr | May | Jun | Jul | Aug | Sep | Oct | Nov | Dec |
|---|---|---|---|---|---|---|---|---|---|---|---|---|
| 1995 | 0 | 0 | 0 | 0 | 0 | 0 | 0 | 0 | 0 | 0 | 0 | 0 |
| 1996 | 330 | 0 | 0 | 0 | 0 | 0 | 0 | 0 | 0 | 0 | 0 | 0 |
| 1997 | 0 | 0 | 0 | 0 | 0 | 0 | 0 | 0 | 0 | 208 | 0 | 0 |
| 1998 | 0 | 0 | 0 | 0 | 99 | 0 | 151 | 0 | 0 | 0 | 0 | 0 |
| 1999 | 0 | 0 | 0 | 0 | 0 | 0 | 0 | 201 | 0 | 0 | 220 | 0 |
| 2000 | 0 | 0 | 0 | 0 | 0 | 0 | 0 | 0 | 262 | 0 | 216 | 50 |
| 2001 | 0 | 270 | 249 | 187 | 0 | 268 | 0 | 294 | 45 | 271 | 264 | 220 |
| 2002 | 190 | 0 | 0 | 0 | 0 | 0 | 0 | 0 | 0 | 364 | 148 | 0 |
| 2003 | 345 | 0 | 111 | 409 | 110 | 0 | 141 | 0 | 0 | 0 | 68 | 233 |
| 2004 | 4 | 910 | 5 | 693 | 262 | 352 | ||||||
| 2005 | 34 | 476 | 295 | 697 | 213 | 2 | 228 | 387 | 321 | 605 | 402 | |
| 2006 | 839 | 1 | 152 | 134 | 89 | 218 | 620 | |||||
| 2007 | 199 | 197 | ||||||||||
| 2009 | 256 | 319 | 208 | |||||||||
| 2010 | 278 | 318 | ||||||||||
| 2012 | 165 | 94 | ||||||||||
| 2015 | 186 | 133 | 32 | 1 | 190 | |||||||
| 2016 | 34 | 118 | 144 | 15 | ||||||||
| 2017 | 228 | |||||||||||
| 2019 | 272 | 74 | ||||||||||
| 2020 | 6 | |||||||||||
| 2021 | 15 | 2 | 277 | 102 | 8 | |||||||
| 2022 | 121 | 5 | 259 | 17 | 31 | |||||||
| 2023 | 18 | 36 | 61 | 70 | 2 | 9 | 235 | |||||
| 2024 | 48 | |||||||||||
| - = No Data Reported; -- = Not Applicable; NA = Not Available; W = Withheld to avoid disclosure of individual company data. |
| Release Date: 3/29/2024 |
| Next Release Date: 4/30/2024 |