|
Download Data (XLS File) |
|
||||||||
|
||||||||
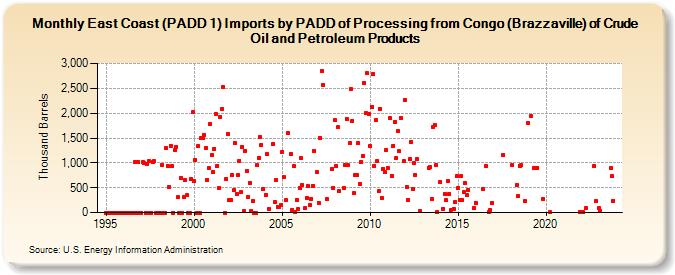
| East Coast (PADD 1) Imports by PADD of Processing from Congo (Brazzaville) of Crude Oil and Petroleum Products (Thousand Barrels) | ||||||||
| Year | Jan | Feb | Mar | Apr | May | Jun | Jul | Aug | Sep | Oct | Nov | Dec |
|---|---|---|---|---|---|---|---|---|---|---|---|---|
| 1995 | 0 | 0 | 0 | 0 | 0 | 0 | 0 | 0 | 0 | 0 | 0 | 0 |
| 1996 | 0 | 0 | 0 | 0 | 0 | 0 | 0 | 0 | 1,019 | 0 | 1,023 | 0 |
| 1997 | 0 | 1,017 | 1,000 | 0 | 984 | 1,029 | 0 | 0 | 1,022 | 1,029 | 0 | 0 |
| 1998 | 0 | 0 | 959 | 0 | 0 | 1,297 | 942 | 517 | 1,349 | 929 | 0 | 1,254 |
| 1999 | 1,328 | 307 | 0 | 692 | 0 | 317 | 665 | 350 | 0 | 0 | 679 | 2,014 |
| 2000 | 626 | 1,065 | 0 | 1,340 | 0 | 1,494 | 1,501 | 1,558 | 1,306 | 664 | 900 | 1,780 |
| 2001 | 1,160 | 815 | 1,289 | 1,988 | 945 | 487 | 1,931 | 2,086 | 2,528 | 0 | 674 | 1,581 |
| 2002 | 253 | 250 | 755 | 447 | 1,399 | 373 | 760 | 1,045 | 413 | 1,315 | 22 | 1,246 |
| 2003 | 834 | 310 | 596 | 41 | 232 | 0 | 0 | 950 | 1,099 | 1,519 | 1,356 | 471 |
| 2004 | 361 | 1,171 | 75 | 1,386 | 209 | 646 | 121 | 104 | 149 | |||
| 2005 | 1,225 | 708 | 251 | 1,605 | 1,177 | 56 | 929 | 11 | 259 | 65 | ||
| 2006 | 488 | 1,092 | 556 | 100 | 298 | 526 | 158 | 276 | 542 | 1,245 | ||
| 2007 | 809 | 200 | 1,510 | 2,853 | 2,571 | 265 | 884 | 500 | ||||
| 2008 | 1,858 | 933 | 1,714 | 435 | 498 | 949 | 1,891 | 949 | 1,396 | 2,482 | ||
| 2009 | 1,847 | 393 | 751 | 750 | 1,390 | 575 | 1,023 | 1,148 | 2,613 | 2,000 | 2,800 | 1,988 |
| 2010 | 1,347 | 2,127 | 2,780 | 946 | 1,858 | 1,034 | 425 | 2,092 | 300 | 882 | 820 | 1,265 |
| 2011 | 902 | 1,894 | 737 | 1,345 | 1,830 | 1,107 | 1,646 | 1,230 | 1,911 | 1,030 | ||
| 2012 | 2,261 | 520 | 261 | 1,072 | 1,424 | 470 | 1,000 | 763 | 1,075 | 29 | ||
| 2013 | 906 | 907 | 270 | 1,728 | 1,764 | 951 | 9 | |||||
| 2014 | 617 | 77 | 372 | 243 | 640 | 373 | 55 | 76 | 212 | 735 | ||
| 2015 | 496 | 257 | 733 | 255 | 409 | 599 | 362 | 450 | 100 | |||
| 2016 | 201 | 477 | 946 | 7 | 49 | 200 | ||||||
| 2017 | 1,156 | |||||||||||
| 2018 | 952 | 546 | 331 | 946 | 951 | 227 | ||||||
| 2019 | 1,801 | 1,934 | 905 | 897 | 276 | |||||||
| 2020 | 4 | |||||||||||
| 2021 | 15 | |||||||||||
| 2022 | 8 | 84 | 939 | 237 | ||||||||
| 2023 | 88 | 38 | 901 | 731 | 241 | |||||||
| - = No Data Reported; -- = Not Applicable; NA = Not Available; W = Withheld to avoid disclosure of individual company data. |
| Release Date: 3/29/2024 |
| Next Release Date: 4/30/2024 |