|
Download Data (XLS File) |
|
||||||||
|
||||||||
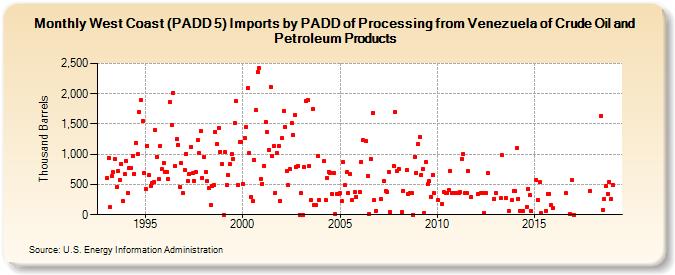
| West Coast (PADD 5) Imports by PADD of Processing from Venezuela of Crude Oil and Petroleum Products (Thousand Barrels) | ||||||||
| Year | Jan | Feb | Mar | Apr | May | Jun | Jul | Aug | Sep | Oct | Nov | Dec |
|---|---|---|---|---|---|---|---|---|---|---|---|---|
| 1993 | 606 | 934 | 120 | 640 | 700 | 920 | 455 | 720 | 574 | 841 | 219 | 670 |
| 1994 | 896 | 367 | 766 | 779 | 975 | 678 | 1,189 | 1,000 | 1,699 | 1,897 | 1,551 | 686 |
| 1995 | 423 | 1,140 | 649 | 481 | 527 | 546 | 1,399 | 962 | 586 | 1,136 | 749 | 859 |
| 1996 | 714 | 704 | 584 | 1,863 | 1,476 | 2,018 | 803 | 1,246 | 1,155 | 462 | 854 | 351 |
| 1997 | 743 | 1,010 | 551 | 680 | 1,127 | 685 | 561 | 711 | 1,230 | 1,014 | 1,380 | 614 |
| 1998 | 957 | 708 | 555 | 438 | 168 | 473 | 494 | 1,368 | 1,172 | 1,430 | 1,041 | 842 |
| 1999 | 0 | 1,032 | 494 | 655 | 833 | 1,001 | 918 | 1,523 | 1,876 | 494 | 1,208 | 1,198 |
| 2000 | 515 | 1,261 | 1,450 | 2,089 | 1,027 | 289 | 230 | 912 | 1,730 | 2,357 | 2,424 | 591 |
| 2001 | 516 | 810 | 1,538 | 1,362 | 1,077 | 2,117 | 973 | 1,136 | 366 | 1,018 | 1,138 | 229 |
| 2002 | 1,265 | 1,718 | 1,457 | 717 | 485 | 752 | 1,513 | 1,321 | 1,653 | 789 | 798 | 0 |
| 2003 | 354 | 0 | 786 | 1,888 | 1,894 | 806 | 240 | 1,740 | 160 | 156 | 971 | 244 |
| 2004 | 882 | 240 | 610 | 711 | 696 | 341 | 693 | 10 | 350 | 348 | ||
| 2005 | 354 | 220 | 869 | 487 | 700 | 367 | 676 | 238 | 370 | 300 | ||
| 2006 | 380 | 879 | 1,229 | 1,215 | 643 | 19 | 922 | 1,687 | 240 | 66 | ||
| 2007 | 263 | 563 | 389 | 376 | 714 | 44 | 803 | 1,703 | 721 | |||
| 2008 | 755 | 44 | 398 | 746 | 350 | 360 | 355 | 2 | 961 | 696 | ||
| 2009 | 1,172 | 1,291 | 663 | 757 | 34 | 873 | 500 | 556 | 300 | 661 | 357 | |
| 2010 | 240 | 178 | 368 | 360 | 360 | 415 | 723 | 356 | 360 | |||
| 2011 | 360 | 355 | 375 | 928 | 1,006 | 356 | 362 | 726 | 296 | |||
| 2012 | 348 | 354 | 355 | 32 | 360 | 686 | 267 | |||||
| 2013 | 361 | 269 | 982 | 279 | 66 | 240 | 393 | |||||
| 2014 | 397 | 1,104 | 265 | 66 | 65 | 135 | 427 | 323 | 56 | |||
| 2015 | 570 | 249 | 539 | 32 | 67 | 347 | 345 | 157 | 105 | |||
| 2016 | 351 | 13 | 569 | |||||||||
| 2017 | 1 | 397 | ||||||||||
| 2018 | 1,631 | 84 | 259 | 471 | 350 | 549 | 268 | |||||
| 2019 | 497 | |||||||||||
| - = No Data Reported; -- = Not Applicable; NA = Not Available; W = Withheld to avoid disclosure of individual company data. |
| Release Date: 3/29/2024 |
| Next Release Date: 4/30/2024 |