|
Download Data (XLS File) |
|
||||||||
|
||||||||
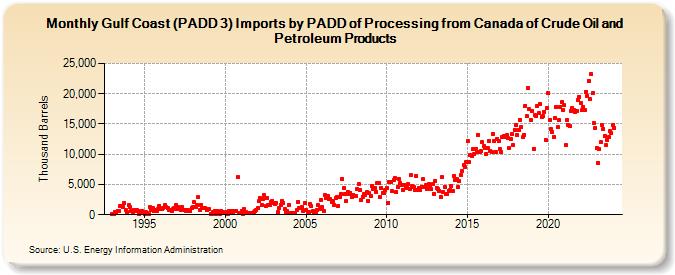
| Gulf Coast (PADD 3) Imports by PADD of Processing from Canada of Crude Oil and Petroleum Products (Thousand Barrels) | ||||||||
| Year | Jan | Feb | Mar | Apr | May | Jun | Jul | Aug | Sep | Oct | Nov | Dec |
|---|---|---|---|---|---|---|---|---|---|---|---|---|
| 1993 | 40 | 196 | 431 | 241 | 600 | 658 | 1,432 | 1,444 | 1,330 | 1,935 | 749 | 444 |
| 1994 | 1,543 | 1,202 | 590 | 520 | 787 | 631 | 793 | 660 | 93 | 352 | 636 | 425 |
| 1995 | 73 | 406 | 289 | 123 | 1,231 | 748 | 1,171 | 609 | 759 | 611 | 936 | 1,511 |
| 1996 | 1,007 | 1,009 | 1,128 | 1,566 | 1,195 | 1,039 | 834 | 755 | 685 | 968 | 1,109 | 1,592 |
| 1997 | 901 | 1,279 | 1,154 | 715 | 1,213 | 798 | 817 | 666 | 756 | 684 | 641 | 1,158 |
| 1998 | 1,262 | 2,037 | 1,204 | 1,578 | 2,859 | 767 | 1,649 | 1,132 | 1,114 | 1,149 | 798 | 1,021 |
| 1999 | 867 | 143 | 133 | 382 | 586 | 159 | 625 | 484 | 133 | 608 | 474 | 322 |
| 2000 | 347 | 486 | 102 | 555 | 257 | 623 | 459 | 655 | 659 | 6,233 | 220 | 289 |
| 2001 | 642 | 185 | 908 | 414 | 240 | 208 | 209 | 245 | 212 | 406 | 567 | 833 |
| 2002 | 1,030 | 2,338 | 2,699 | 1,631 | 2,633 | 3,233 | 1,418 | 2,718 | 1,542 | 1,644 | 2,126 | 2,349 |
| 2003 | 1,919 | 1,707 | 1,973 | 376 | 1,179 | 1,607 | 2,263 | 2,018 | 913 | 420 | 561 | 1,603 |
| 2004 | 323 | 336 | 219 | 208 | 213 | 711 | 2,152 | 1,129 | 1,136 | 1,248 | 551 | 1,936 |
| 2005 | 856 | 266 | 377 | 1,789 | 1,386 | 584 | 364 | 459 | 857 | 1,528 | 894 | 2,438 |
| 2006 | 1,247 | 623 | 3,271 | 2,700 | 3,067 | 2,591 | 2,534 | 2,133 | 2,202 | 1,675 | 2,701 | 2,882 |
| 2007 | 1,514 | 2,985 | 3,472 | 5,909 | 4,410 | 3,422 | 2,257 | 3,799 | 3,414 | 3,662 | 2,951 | 3,335 |
| 2008 | 3,145 | 3,170 | 4,269 | 5,010 | 4,098 | 2,386 | 2,943 | 3,423 | 3,330 | 3,782 | 2,325 | 3,546 |
| 2009 | 3,089 | 4,823 | 4,234 | 4,423 | 3,819 | 5,249 | 5,305 | 2,846 | 4,487 | 3,647 | 3,571 | 4,133 |
| 2010 | 4,411 | 1,993 | 5,403 | 5,425 | 3,876 | 5,720 | 6,091 | 3,786 | 4,556 | 5,867 | 5,321 | 4,941 |
| 2011 | 4,164 | 4,975 | 4,459 | 4,509 | 5,061 | 4,321 | 6,531 | 4,750 | 4,525 | 4,083 | 6,376 | 4,020 |
| 2012 | 4,452 | 4,081 | 4,664 | 5,840 | 4,625 | 4,831 | 4,305 | 5,049 | 4,536 | 4,299 | 5,038 | 3,506 |
| 2013 | 5,566 | 4,463 | 4,203 | 3,930 | 2,955 | 6,167 | 3,704 | 4,636 | 3,481 | 3,402 | 4,000 | 4,091 |
| 2014 | 4,735 | 3,889 | 6,470 | 5,787 | 5,895 | 4,554 | 5,528 | 6,554 | 7,211 | 8,176 | 7,889 | 8,689 |
| 2015 | 12,120 | 8,645 | 9,909 | 9,787 | 10,812 | 9,973 | 10,855 | 10,346 | 13,191 | 10,369 | 10,465 | 12,044 |
| 2016 | 11,396 | 11,024 | 10,057 | 10,983 | 12,242 | 10,460 | 10,390 | 13,353 | 12,128 | 10,286 | 12,546 | 12,141 |
| 2017 | 10,936 | 10,378 | 12,827 | 12,953 | 12,832 | 13,137 | 12,665 | 10,966 | 12,434 | 13,318 | 11,452 | 14,029 |
| 2018 | 14,823 | 13,142 | 14,040 | 15,723 | 14,482 | 12,792 | 13,232 | 18,017 | 16,253 | 20,949 | 17,394 | 15,605 |
| 2019 | 17,126 | 10,917 | 16,474 | 16,252 | 18,025 | 16,757 | 18,270 | 16,172 | 16,342 | 17,026 | 12,411 | 17,652 |
| 2020 | 20,098 | 15,629 | 14,160 | 13,671 | 12,879 | 15,994 | 17,861 | 14,509 | 15,583 | 17,865 | 18,585 | 17,351 |
| 2021 | 18,065 | 11,478 | 15,700 | 14,783 | 14,616 | 17,178 | 17,700 | 17,386 | 16,990 | 17,098 | 18,939 | 19,499 |
| 2022 | 18,524 | 17,295 | 17,872 | 17,275 | 20,327 | 19,665 | 22,084 | 19,071 | 23,228 | 20,051 | 15,198 | 14,344 |
| 2023 | 11,054 | 8,627 | 10,838 | 11,951 | 14,814 | 14,179 | 12,962 | 11,511 | 12,421 | 12,779 | 13,823 | 13,438 |
| 2024 | 14,791 | |||||||||||
| - = No Data Reported; -- = Not Applicable; NA = Not Available; W = Withheld to avoid disclosure of individual company data. |
| Release Date: 3/29/2024 |
| Next Release Date: 4/30/2024 |