|
Download Data (XLS File) |
|
||||||||
|
||||||||
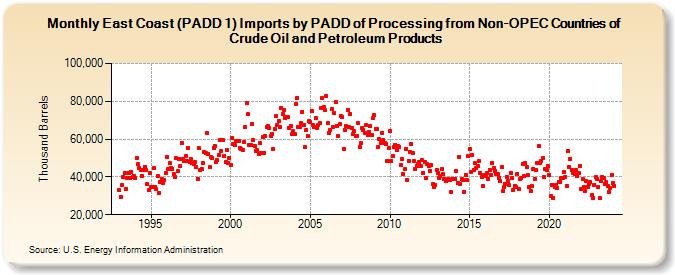
| East Coast (PADD 1) Imports by PADD of Processing from Non-OPEC Countries of Crude Oil and Petroleum Products (Thousand Barrels) | ||||||||
| Year | Jan | Feb | Mar | Apr | May | Jun | Jul | Aug | Sep | Oct | Nov | Dec |
|---|---|---|---|---|---|---|---|---|---|---|---|---|
| 1993 | 33,002 | 29,567 | 35,682 | 40,161 | 42,116 | 33,803 | 39,297 | 42,180 | 39,411 | 42,854 | 39,878 | 40,648 |
| 1994 | 39,376 | 50,195 | 46,651 | 44,641 | 43,812 | 40,621 | 43,846 | 45,451 | 43,613 | 36,032 | 32,834 | 41,957 |
| 1995 | 34,767 | 34,565 | 44,674 | 34,761 | 33,408 | 40,291 | 31,672 | 37,316 | 38,786 | 36,536 | 38,407 | 42,276 |
| 1996 | 50,290 | 44,105 | 47,387 | 44,896 | 44,292 | 41,412 | 39,955 | 49,782 | 43,056 | 49,595 | 45,596 | 57,773 |
| 1997 | 49,550 | 48,572 | 51,023 | 48,204 | 55,214 | 48,106 | 49,271 | 47,512 | 47,035 | 47,822 | 45,320 | 39,056 |
| 1998 | 55,149 | 43,631 | 44,086 | 47,255 | 53,342 | 52,693 | 62,965 | 52,241 | 45,154 | 50,558 | 50,235 | 55,477 |
| 1999 | 56,277 | 47,726 | 48,759 | 51,584 | 59,617 | 53,503 | 59,531 | 51,067 | 47,880 | 54,346 | 47,293 | 49,959 |
| 2000 | 46,457 | 60,706 | 57,447 | 56,738 | 58,944 | 59,194 | 59,189 | 55,476 | 54,710 | 54,362 | 58,617 | 66,535 |
| 2001 | 78,927 | 73,157 | 56,668 | 56,973 | 67,876 | 59,430 | 56,563 | 53,859 | 54,041 | 51,949 | 57,983 | 52,872 |
| 2002 | 60,933 | 52,877 | 61,492 | 66,181 | 66,930 | 65,947 | 61,832 | 62,811 | 54,866 | 65,400 | 72,244 | 67,458 |
| 2003 | 69,701 | 66,389 | 76,692 | 73,025 | 75,441 | 70,992 | 71,811 | 71,509 | 65,858 | 67,036 | 62,756 | 64,096 |
| 2004 | 62,586 | 78,477 | 81,847 | 66,477 | 66,643 | 68,551 | 74,598 | 67,251 | 55,798 | 65,051 | 61,668 | 69,457 |
| 2005 | 69,032 | 74,965 | 67,532 | 66,384 | 70,968 | 65,925 | 67,686 | 68,413 | 76,606 | 81,599 | 76,747 | 75,191 |
| 2006 | 82,925 | 68,295 | 63,450 | 64,999 | 75,828 | 66,571 | 73,768 | 79,679 | 67,152 | 61,703 | 67,792 | 72,247 |
| 2007 | 71,715 | 54,903 | 65,062 | 66,745 | 75,317 | 66,462 | 73,534 | 65,977 | 62,528 | 64,070 | 61,532 | 61,591 |
| 2008 | 68,296 | 55,624 | 57,789 | 66,129 | 64,980 | 63,326 | 67,296 | 62,376 | 63,821 | 66,963 | 62,373 | 70,953 |
| 2009 | 72,660 | 65,239 | 65,395 | 55,681 | 59,816 | 57,905 | 63,387 | 59,654 | 57,746 | 57,540 | 48,526 | 55,278 |
| 2010 | 64,496 | 48,477 | 51,090 | 56,021 | 56,903 | 54,266 | 56,373 | 55,941 | 46,389 | 49,356 | 41,434 | 43,961 |
| 2011 | 54,773 | 38,310 | 48,641 | 53,379 | 57,629 | 52,441 | 48,344 | 43,921 | 45,819 | 46,727 | 47,771 | 45,585 |
| 2012 | 48,761 | 42,097 | 47,739 | 39,480 | 46,685 | 45,714 | 43,370 | 46,240 | 36,120 | 34,799 | 35,943 | 43,740 |
| 2013 | 41,864 | 39,197 | 40,233 | 44,197 | 41,324 | 38,856 | 37,903 | 38,195 | 39,002 | 38,372 | 32,277 | 38,676 |
| 2014 | 38,789 | 38,853 | 42,896 | 36,587 | 50,554 | 36,445 | 38,671 | 38,301 | 32,199 | 41,171 | 38,220 | 51,096 |
| 2015 | 54,668 | 42,812 | 51,777 | 43,902 | 47,194 | 44,598 | 45,821 | 48,160 | 42,166 | 40,072 | 35,069 | 40,823 |
| 2016 | 40,513 | 42,068 | 39,004 | 43,712 | 40,883 | 47,615 | 44,641 | 43,116 | 41,595 | 41,522 | 39,162 | 37,771 |
| 2017 | 45,186 | 32,543 | 34,831 | 36,205 | 40,100 | 37,772 | 35,489 | 42,108 | 39,187 | 33,248 | 35,364 | 34,735 |
| 2018 | 41,558 | 33,559 | 38,663 | 39,372 | 47,070 | 40,476 | 47,244 | 45,500 | 40,801 | 34,572 | 32,740 | 34,999 |
| 2019 | 44,355 | 38,722 | 43,636 | 47,278 | 56,253 | 47,185 | 48,449 | 49,775 | 40,023 | 44,324 | 43,737 | 45,697 |
| 2020 | 41,169 | 29,783 | 35,900 | 29,026 | 34,613 | 35,536 | 34,079 | 37,327 | 37,075 | 39,484 | 39,527 | 42,664 |
| 2021 | 40,086 | 35,280 | 53,856 | 45,428 | 49,613 | 43,530 | 41,907 | 41,317 | 43,903 | 40,571 | 41,945 | 45,952 |
| 2022 | 33,350 | 38,645 | 34,637 | 32,488 | 37,624 | 34,880 | 36,327 | 37,240 | 30,323 | 29,081 | 35,800 | 40,062 |
| 2023 | 38,979 | 34,901 | 28,602 | 37,741 | 39,790 | 39,485 | 35,986 | 37,076 | 35,144 | 31,764 | 34,374 | 41,146 |
| 2024 | 36,956 | |||||||||||
| - = No Data Reported; -- = Not Applicable; NA = Not Available; W = Withheld to avoid disclosure of individual company data. |
| Release Date: 3/29/2024 |
| Next Release Date: 4/30/2024 |