|
Download Data (XLS File) |
|
||||||||
|
||||||||
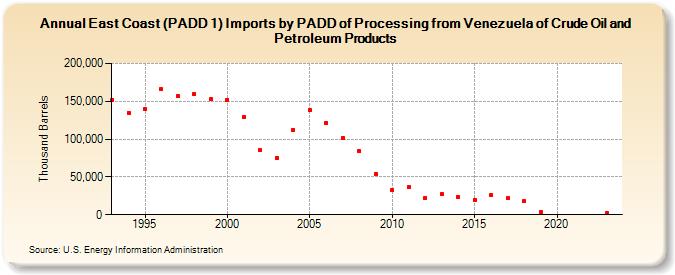
| East Coast (PADD 1) Imports by PADD of Processing from Venezuela of Crude Oil and Petroleum Products (Thousand Barrels) | ||||||||
| Decade | Year-0 | Year-1 | Year-2 | Year-3 | Year-4 | Year-5 | Year-6 | Year-7 | Year-8 | Year-9 |
|---|---|---|---|---|---|---|---|---|---|---|
| 1990's | 152,223 | 134,846 | 140,052 | 165,861 | 157,245 | 159,507 | 152,982 | |||
| 2000's | 151,831 | 129,343 | 85,185 | 74,713 | 112,304 | 138,111 | 121,394 | 101,769 | 83,943 | 53,561 |
| 2010's | 32,927 | 36,564 | 22,267 | 27,419 | 23,712 | 19,203 | 26,299 | 21,544 | 17,620 | 3,451 |
| 2020's | 1,735 |
| - = No Data Reported; -- = Not Applicable; NA = Not Available; W = Withheld to avoid disclosure of individual company data. |
| Release Date: 3/29/2024 |
| Next Release Date: 8/30/2024 |