|
Download Data (XLS File) |
|
||||||||
|
||||||||
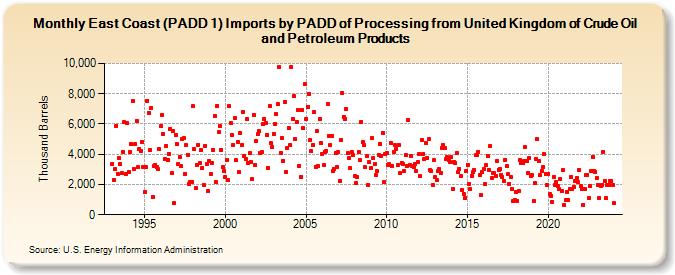
| East Coast (PADD 1) Imports by PADD of Processing from United Kingdom of Crude Oil and Petroleum Products (Thousand Barrels) | ||||||||
| Year | Jan | Feb | Mar | Apr | May | Jun | Jul | Aug | Sep | Oct | Nov | Dec |
|---|---|---|---|---|---|---|---|---|---|---|---|---|
| 1993 | 3,379 | 2,301 | 3,004 | 5,897 | 2,714 | 3,769 | 3,335 | 2,736 | 4,140 | 6,104 | 2,670 | 6,045 |
| 1994 | 2,845 | 4,163 | 4,681 | 7,501 | 3,026 | 4,680 | 6,210 | 3,130 | 4,370 | 4,243 | 4,820 | 3,173 |
| 1995 | 1,503 | 3,134 | 7,536 | 6,732 | 4,272 | 7,061 | 1,178 | 3,198 | 3,280 | 3,124 | 2,998 | 4,323 |
| 1996 | 5,868 | 6,596 | 5,364 | 3,689 | 4,569 | 3,607 | 4,041 | 5,674 | 2,748 | 5,539 | 766 | 5,263 |
| 1997 | 4,679 | 3,371 | 3,819 | 3,202 | 5,032 | 5,054 | 2,721 | 4,581 | 3,979 | 2,016 | 2,152 | 2,189 |
| 1998 | 7,168 | 4,361 | 1,775 | 3,302 | 4,614 | 3,395 | 4,278 | 3,111 | 1,964 | 4,531 | 3,323 | 1,563 |
| 1999 | 3,548 | 2,662 | 3,398 | 4,293 | 6,507 | 2,187 | 7,209 | 5,437 | 5,874 | 4,306 | 3,149 | 2,898 |
| 2000 | 2,512 | 3,636 | 2,265 | 7,165 | 6,040 | 5,259 | 4,607 | 6,372 | 3,592 | 4,832 | 2,800 | 5,376 |
| 2001 | 4,590 | 6,799 | 3,881 | 3,713 | 6,328 | 3,439 | 4,051 | 3,487 | 2,367 | 6,606 | 3,305 | 4,897 |
| 2002 | 5,318 | 5,514 | 4,053 | 4,128 | 5,967 | 6,320 | 6,073 | 5,279 | 3,115 | 7,195 | 4,733 | 4,471 |
| 2003 | 5,336 | 6,028 | 6,644 | 7,293 | 9,739 | 4,090 | 5,102 | 3,573 | 7,438 | 2,846 | 4,411 | 5,752 |
| 2004 | 4,590 | 9,784 | 6,349 | 7,824 | 4,982 | 6,147 | 6,957 | 3,221 | 2,512 | 6,924 | 5,724 | 8,619 |
| 2005 | 6,316 | 7,114 | 8,001 | 4,942 | 4,183 | 4,636 | 6,793 | 3,169 | 5,528 | 3,198 | 6,341 | 4,709 |
| 2006 | 4,024 | 3,268 | 4,172 | 4,236 | 7,352 | 5,218 | 4,590 | 5,227 | 2,880 | 3,018 | 4,109 | 3,144 |
| 2007 | 4,116 | 2,250 | 4,960 | 8,046 | 6,492 | 6,317 | 6,997 | 4,060 | 3,767 | 3,086 | 4,177 | 3,933 |
| 2008 | 2,530 | 2,084 | 2,482 | 4,146 | 3,641 | 6,147 | 4,790 | 4,642 | 3,131 | 3,870 | 1,965 | 3,473 |
| 2009 | 3,093 | 5,079 | 3,763 | 3,368 | 2,633 | 2,863 | 3,941 | 4,681 | 3,907 | 5,429 | 2,174 | 4,045 |
| 2010 | 4,112 | 3,315 | 3,327 | 4,742 | 3,238 | 4,163 | 4,622 | 4,370 | 3,285 | 4,638 | 2,751 | 3,448 |
| 2011 | 3,357 | 2,878 | 3,972 | 3,217 | 6,291 | 3,312 | 3,873 | 3,239 | 3,126 | 3,366 | 2,890 | 3,467 |
| 2012 | 4,011 | 2,575 | 4,967 | 4,041 | 3,698 | 4,726 | 3,754 | 5,006 | 2,954 | 2,873 | 1,971 | 3,599 |
| 2013 | 2,495 | 2,312 | 2,907 | 2,999 | 2,745 | 4,438 | 4,583 | 4,381 | 3,656 | 3,794 | 3,619 | 3,497 |
| 2014 | 3,785 | 1,718 | 3,507 | 3,428 | 4,087 | 2,823 | 3,051 | 2,539 | 1,618 | 1,400 | 1,083 | 2,876 |
| 2015 | 3,297 | 2,024 | 1,701 | 2,591 | 2,823 | 2,978 | 3,928 | 3,926 | 4,176 | 2,622 | 1,310 | 2,793 |
| 2016 | 3,011 | 2,040 | 3,269 | 3,897 | 2,988 | 4,558 | 2,398 | 2,748 | 2,733 | 2,560 | 3,579 | 2,988 |
| 2017 | 3,054 | 2,641 | 2,510 | 2,204 | 3,635 | 3,220 | 2,675 | 2,062 | 2,508 | 1,726 | 932 | 960 |
| 2018 | 1,517 | 936 | 1,578 | 3,645 | 3,423 | 3,430 | 3,522 | 4,452 | 3,519 | 2,778 | 3,753 | 2,591 |
| 2019 | 2,607 | 918 | 2,066 | 3,705 | 4,982 | 3,574 | 2,594 | 2,886 | 3,153 | 4,005 | 2,709 | 1,977 |
| 2020 | 2,693 | 1,344 | 1,238 | 859 | 2,495 | 1,985 | 2,153 | 1,930 | 1,693 | 2,345 | 1,546 | 2,971 |
| 2021 | 656 | 961 | 1,533 | 962 | 1,707 | 2,480 | 1,700 | 1,846 | 2,256 | 2,443 | 2,160 | 2,948 |
| 2022 | 1,884 | 1,721 | 655 | 1,687 | 2,613 | 2,638 | 1,081 | 1,885 | 2,877 | 3,831 | 2,922 | 2,847 |
| 2023 | 2,457 | 1,987 | 1,117 | 1,869 | 1,995 | 4,158 | 2,230 | 1,087 | 1,965 | 1,988 | 2,197 | 2,213 |
| 2024 | 1,996 | |||||||||||
| - = No Data Reported; -- = Not Applicable; NA = Not Available; W = Withheld to avoid disclosure of individual company data. |
| Release Date: 3/29/2024 |
| Next Release Date: 4/30/2024 |