|
Download Data (XLS File) |
|
||||||||
|
||||||||
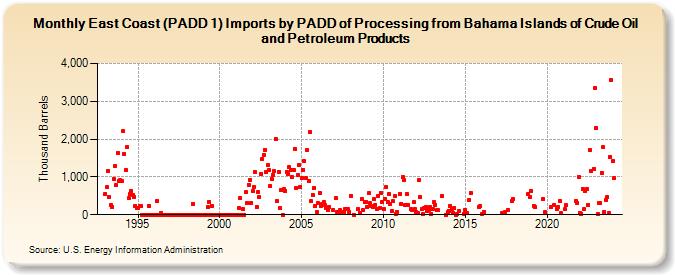
| East Coast (PADD 1) Imports by PADD of Processing from Bahama Islands of Crude Oil and Petroleum Products (Thousand Barrels) | ||||||||
| Year | Jan | Feb | Mar | Apr | May | Jun | Jul | Aug | Sep | Oct | Nov | Dec |
|---|---|---|---|---|---|---|---|---|---|---|---|---|
| 1993 | 550 | 726 | 1,163 | 475 | 252 | 212 | 951 | 1,279 | 781 | 1,642 | 884 | 916 |
| 1994 | 882 | 2,207 | 1,608 | 1,177 | 1,787 | 433 | 547 | 632 | 509 | 480 | 240 | 182 |
| 1995 | 189 | 235 | 219 | 0 | 0 | 0 | 0 | 0 | 234 | 0 | 0 | 0 |
| 1996 | 0 | 0 | 367 | 0 | 0 | 41 | 0 | 0 | 0 | 0 | 0 | 0 |
| 1997 | 0 | 0 | 0 | 0 | 0 | 0 | 0 | 0 | 0 | 0 | 0 | 0 |
| 1998 | 0 | 0 | 0 | 0 | 285 | 0 | 0 | 0 | 0 | 0 | 0 | 0 |
| 1999 | 0 | 0 | 0 | 201 | 346 | 0 | 242 | 0 | 0 | 0 | 0 | 0 |
| 2000 | 0 | 0 | 0 | 0 | 0 | 0 | 0 | 0 | 0 | 0 | 0 | 0 |
| 2001 | 0 | 0 | 182 | 429 | 0 | 141 | 0 | 591 | 314 | 799 | 925 | 315 |
| 2002 | 630 | 727 | 1,127 | 208 | 604 | 472 | 1,078 | 1,461 | 1,587 | 1,719 | 1,121 | 1,302 |
| 2003 | 1,174 | 758 | 945 | 1,052 | 1,147 | 2,013 | 350 | 1,132 | 165 | 655 | 0 | 670 |
| 2004 | 631 | 1,140 | 1,087 | 1,256 | 1,182 | 996 | 1,177 | 1,739 | 706 | 1,056 | 1,315 | 746 |
| 2005 | 984 | 1,192 | 1,411 | 972 | 1,704 | 901 | 2,186 | 354 | 531 | 710 | 225 | 81 |
| 2006 | 302 | 581 | 223 | 290 | 331 | 255 | 173 | 115 | 217 | 131 | ||
| 2007 | 441 | 71 | 117 | 44 | 77 | 78 | 140 | 144 | 140 | 73 | ||
| 2008 | 496 | 2 | 154 | 51 | 427 | 114 | 343 | 346 | ||||
| 2009 | 212 | 563 | 306 | 233 | 198 | 415 | 257 | 161 | 489 | 179 | 585 | 347 |
| 2010 | 155 | 416 | 735 | 338 | 549 | 286 | 108 | 357 | 497 | 28 | 85 | |
| 2011 | 548 | 295 | 1,004 | 919 | 265 | 544 | 250 | 152 | 114 | 329 | 149 | |
| 2012 | 64 | 38 | 919 | 469 | 154 | 13 | 171 | 191 | 100 | 125 | 210 | 28 |
| 2013 | 150 | 325 | 265 | 116 | 115 | 489 | 5 | 75 | ||||
| 2014 | 100 | 231 | 158 | 48 | 178 | 1 | 23 | 97 | 27 | |||
| 2015 | 137 | 52 | 393 | 575 | 200 | 227 | ||||||
| 2016 | 20 | 78 | ||||||||||
| 2017 | 43 | 66 | 119 | 359 | 421 | |||||||
| 2018 | 543 | 463 | ||||||||||
| 2019 | 622 | 241 | 200 | 422 | 60 | |||||||
| 2020 | 215 | 248 | 159 | 192 | 368 | 41 | ||||||
| 2021 | 138 | 250 | 372 | 310 | 1,000 | |||||||
| 2022 | 48 | 32 | 688 | 143 | 628 | 680 | 249 | 1,716 | 1,164 | 1,220 | 3,353 | |
| 2023 | 2,296 | 16 | 314 | 304 | 1,105 | 1,779 | 75 | 401 | 466 | 37 | 1,538 | 3,558 |
| 2024 | 1,410 | |||||||||||
| - = No Data Reported; -- = Not Applicable; NA = Not Available; W = Withheld to avoid disclosure of individual company data. |
| Release Date: 3/29/2024 |
| Next Release Date: 4/30/2024 |