|
Download Data (XLS File) |
|
||||||||
|
||||||||
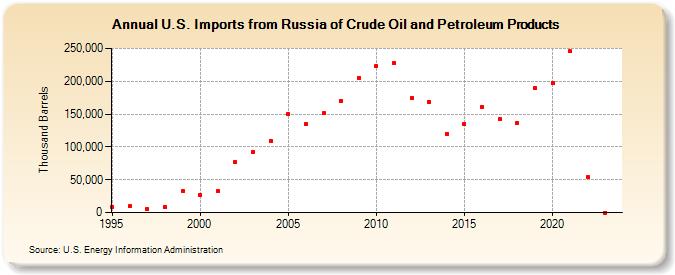
| U.S. Imports from Russia of Crude Oil and Petroleum Products (Thousand Barrels) | ||||||||
| Decade | Year-0 | Year-1 | Year-2 | Year-3 | Year-4 | Year-5 | Year-6 | Year-7 | Year-8 | Year-9 |
|---|---|---|---|---|---|---|---|---|---|---|
| 1990's | 9,071 | 9,251 | 4,725 | 8,683 | 32,611 | |||||
| 2000's | 26,382 | 32,783 | 76,690 | 92,711 | 109,151 | 149,681 | 134,646 | 151,074 | 170,264 | 205,525 |
| 2010's | 223,370 | 227,774 | 174,612 | 168,024 | 120,345 | 135,247 | 161,286 | 142,011 | 137,010 | 189,786 |
| 2020's | 197,720 | 245,633 | 53,779 | 10 |
| - = No Data Reported; -- = Not Applicable; NA = Not Available; W = Withheld to avoid disclosure of individual company data. |
| Release Date: 3/29/2024 |
| Next Release Date: 8/30/2024 |