|
Download Data (XLS File) |
|
||||||||
|
||||||||
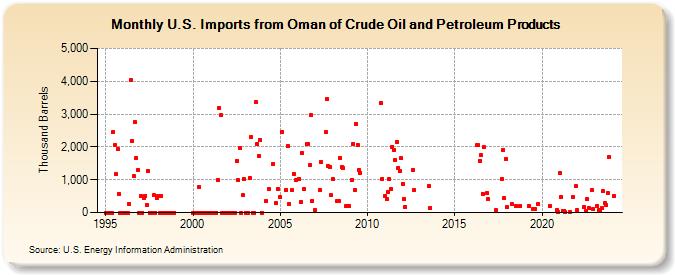
| U.S. Imports from Oman of Crude Oil and Petroleum Products (Thousand Barrels) | ||||||||
| Year | Jan | Feb | Mar | Apr | May | Jun | Jul | Aug | Sep | Oct | Nov | Dec |
|---|---|---|---|---|---|---|---|---|---|---|---|---|
| 1995 | 0 | 0 | 0 | 0 | 0 | 2,439 | 2,049 | 1,160 | 1,925 | 572 | 0 | 0 |
| 1996 | 0 | 0 | 0 | 0 | 269 | 4,032 | 2,180 | 1,099 | 2,752 | 1,664 | 1,300 | 0 |
| 1997 | 499 | 0 | 451 | 510 | 240 | 1,271 | 0 | 0 | 0 | 527 | 0 | 443 |
| 1998 | 512 | 0 | 501 | 0 | 0 | 0 | 0 | 0 | 0 | 0 | 0 | 0 |
| 2000 | 0 | 0 | 0 | 0 | 782 | 0 | 0 | 0 | 0 | 0 | 0 | 0 |
| 2001 | 0 | 0 | 0 | 0 | 0 | 992 | 3,184 | 2,962 | 0 | 0 | 0 | 0 |
| 2002 | 0 | 0 | 0 | 0 | 0 | 0 | 1,585 | 982 | 1,957 | 0 | 521 | 1,015 |
| 2003 | 0 | 0 | 0 | 1,039 | 2,307 | 0 | 0 | 3,359 | 2,094 | 1,732 | 2,205 | 0 |
| 2004 | 352 | 723 | 1,484 | 287 | 724 | |||||||
| 2005 | 477 | 2,452 | 689 | 2,036 | 262 | 679 | 1,188 | 998 | ||||
| 2006 | 1,024 | 330 | 1,813 | 718 | 2,086 | 2,094 | 1,444 | 2,958 | 359 | |||
| 2007 | 65 | 692 | 1,548 | 2,442 | 3,461 | 1,413 | 1,395 | 522 | ||||
| 2008 | 1,027 | 351 | 367 | 1,671 | 1,385 | 1,366 | 198 | 190 | 210 | |||
| 2009 | 997 | 2,097 | 691 | 2,695 | 2,063 | 1,294 | 1,209 | |||||
| 2010 | 3,331 | 1,026 | ||||||||||
| 2011 | 503 | 400 | 624 | 1,027 | 715 | 1,995 | 1,909 | 1,608 | 2,155 | 1,360 | 1,258 | 1,651 |
| 2012 | 875 | 406 | 183 | 1,311 | 685 | |||||||
| 2013 | 802 | 149 | ||||||||||
| 2016 | 2,044 | 2,051 | 1,579 | 1,741 | 574 | 1,983 | 597 | 417 | ||||
| 2017 | 65 | 1,037 | 1,920 | 439 | 1,636 | |||||||
| 2018 | 161 | 261 | 208 | 198 | ||||||||
| 2019 | 204 | 94 | 113 | 256 | ||||||||
| 2020 | 200 | 79 | 23 | |||||||||
| 2021 | 1,206 | 459 | 49 | 57 | 4 | 4 | 469 | 808 | ||||
| 2022 | 65 | 158 | 50 | 398 | 133 | 679 | 98 | |||||
| 2023 | 185 | 78 | 38 | 132 | 645 | 283 | 217 | 606 | 1,683 | |||
| - = No Data Reported; -- = Not Applicable; NA = Not Available; W = Withheld to avoid disclosure of individual company data. |
| Release Date: 3/29/2024 |
| Next Release Date: 4/30/2024 |