|
Download Data (XLS File) |
|
||||||||
|
||||||||
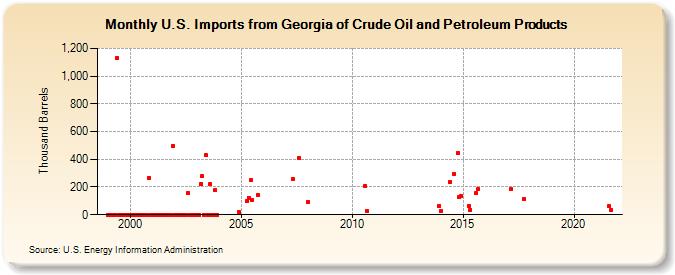
| U.S. Imports from Georgia of Crude Oil and Petroleum Products (Thousand Barrels) | ||||||||
| Year | Jan | Feb | Mar | Apr | May | Jun | Jul | Aug | Sep | Oct | Nov | Dec |
|---|---|---|---|---|---|---|---|---|---|---|---|---|
| 1999 | 0 | 0 | 0 | 0 | 0 | 1,129 | 0 | 0 | 0 | 0 | 0 | 0 |
| 2000 | 0 | 0 | 0 | 0 | 0 | 0 | 0 | 0 | 0 | 0 | 268 | 0 |
| 2001 | 0 | 0 | 0 | 0 | 0 | 0 | 0 | 0 | 0 | 0 | 0 | 498 |
| 2002 | 0 | 0 | 0 | 0 | 0 | 0 | 0 | 158 | 0 | 0 | 0 | 0 |
| 2003 | 0 | 0 | 220 | 276 | 0 | 429 | 0 | 218 | 0 | 0 | 179 | 0 |
| 2004 | 19 | |||||||||||
| 2005 | 100 | 123 | 248 | 107 | 144 | |||||||
| 2007 | 260 | 409 | ||||||||||
| 2008 | 92 | |||||||||||
| 2010 | 208 | 25 | ||||||||||
| 2013 | 63 | |||||||||||
| 2014 | 27 | 237 | 297 | 446 | 129 | 133 | ||||||
| 2015 | 61 | 36 | 156 | 184 | ||||||||
| 2017 | 183 | 112 | ||||||||||
| 2021 | 61 | 37 | ||||||||||
| - = No Data Reported; -- = Not Applicable; NA = Not Available; W = Withheld to avoid disclosure of individual company data. |
| Release Date: 3/29/2024 |
| Next Release Date: 4/30/2024 |