|
Download Data (XLS File) |
|
||||||||
|
||||||||
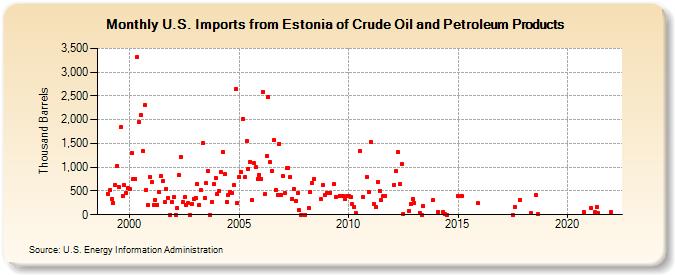
| U.S. Imports from Estonia of Crude Oil and Petroleum Products (Thousand Barrels) | ||||||||
| Year | Jan | Feb | Mar | Apr | May | Jun | Jul | Aug | Sep | Oct | Nov | Dec |
|---|---|---|---|---|---|---|---|---|---|---|---|---|
| 1999 | 442 | 512 | 333 | 253 | 628 | 1,023 | 586 | 1,840 | 396 | 621 | 466 | 552 |
| 2000 | 533 | 1,297 | 759 | 754 | 3,314 | 1,942 | 2,098 | 1,340 | 2,307 | 526 | 204 | 797 |
| 2001 | 680 | 205 | 311 | 207 | 478 | 812 | 711 | 262 | 549 | 359 | 0 | 270 |
| 2002 | 370 | 0 | 145 | 828 | 1,219 | 265 | 363 | 198 | 249 | 0 | 234 | 327 |
| 2003 | 361 | 646 | 209 | 512 | 1,503 | 360 | 659 | 914 | 0 | 264 | 638 | 776 |
| 2004 | 431 | 506 | 899 | 1,321 | 851 | 264 | 423 | 488 | 461 | 620 | 2,649 | 247 |
| 2005 | 801 | 901 | 2,019 | 784 | 1,547 | 965 | 1,119 | 312 | 1,081 | 997 | 755 | 841 |
| 2006 | 752 | 2,589 | 432 | 1,243 | 2,481 | 1,105 | 916 | 1,562 | 517 | 416 | 1,494 | 418 |
| 2007 | 805 | 449 | 977 | 976 | 794 | 340 | 538 | 287 | 460 | 89 | 1 | |
| 2008 | 1 | 142 | 480 | 670 | 749 | 322 | 626 | 420 | ||||
| 2009 | 463 | 458 | 645 | 383 | 397 | 389 | 327 | 393 | ||||
| 2010 | 390 | 363 | 221 | 160 | 35 | 1,335 | 374 | 796 | 484 | |||
| 2011 | 1,534 | 232 | 159 | 692 | 496 | 303 | 397 | 394 | ||||
| 2012 | 627 | 910 | 1,316 | 646 | 1,071 | 12 | 81 | 226 | 327 | |||
| 2013 | 250 | 39 | 1 | 183 | 300 | |||||||
| 2014 | 58 | 52 | 6 | 1 | ||||||||
| 2015 | 398 | 394 | 238 | |||||||||
| 2017 | 1 | 171 | 318 | |||||||||
| 2018 | 32 | 406 | 10 | |||||||||
| 2020 | 55 | |||||||||||
| 2021 | 147 | 48 | 171 | 28 | ||||||||
| 2022 | 49 | |||||||||||
| - = No Data Reported; -- = Not Applicable; NA = Not Available; W = Withheld to avoid disclosure of individual company data. |
| Release Date: 3/29/2024 |
| Next Release Date: 4/30/2024 |