|
Download Data (XLS File) |
|
||||||||
|
||||||||
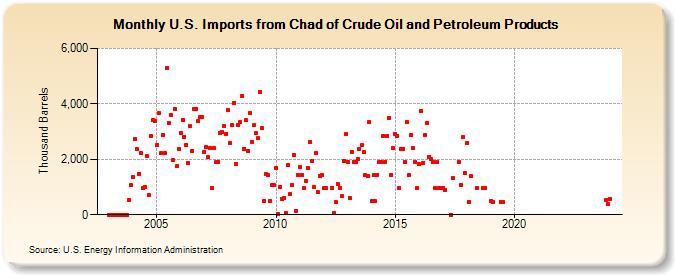
| U.S. Imports from Chad of Crude Oil and Petroleum Products (Thousand Barrels) | ||||||||
| Year | Jan | Feb | Mar | Apr | May | Jun | Jul | Aug | Sep | Oct | Nov | Dec |
|---|---|---|---|---|---|---|---|---|---|---|---|---|
| 2003 | 0 | 0 | 0 | 0 | 0 | 0 | 0 | 0 | 0 | 0 | 523 | 1,054 |
| 2004 | 1,360 | 2,726 | 2,357 | 1,483 | 2,220 | 962 | 1,009 | 2,119 | 725 | 2,835 | 3,407 | 3,389 |
| 2005 | 2,510 | 3,655 | 2,216 | 2,878 | 2,233 | 5,280 | 3,298 | 3,614 | 1,957 | 3,821 | 1,740 | 2,372 |
| 2006 | 2,948 | 3,429 | 2,816 | 2,515 | 1,872 | 3,185 | 2,305 | 3,815 | 3,814 | 3,394 | 3,527 | 3,523 |
| 2007 | 2,267 | 2,436 | 2,072 | 2,411 | 957 | 2,390 | 1,904 | 1,911 | 2,942 | 2,984 | 3,205 | 2,921 |
| 2008 | 3,766 | 2,594 | 3,222 | 4,035 | 1,813 | 3,238 | 3,336 | 4,299 | 2,385 | 3,407 | 2,312 | 3,673 |
| 2009 | 2,639 | 3,220 | 2,931 | 2,761 | 4,433 | 3,118 | 510 | 1,462 | 1,436 | 502 | 1,068 | 1,054 |
| 2010 | 1,686 | 17 | 1,007 | 549 | 595 | 74 | 1,790 | 753 | 1,073 | 2,168 | 151 | 1,449 |
| 2011 | 1,730 | 1,436 | 952 | 1,219 | 1,700 | 2,618 | 1,923 | 1,006 | 2,224 | 827 | 1,409 | 1,429 |
| 2012 | 952 | 952 | 950 | 72 | 467 | 1,126 | 970 | 662 | 1,953 | 2,900 | ||
| 2013 | 1,913 | 600 | 2,275 | 1,906 | 1,910 | 2,021 | 2,381 | 2,498 | 2,268 | 1,429 | 1,409 | 3,334 |
| 2014 | 477 | 1,422 | 483 | 1,443 | 1,919 | 1,908 | 2,848 | 1,907 | 2,856 | 3,504 | 1,430 | 2,396 |
| 2015 | 2,898 | 2,854 | 955 | 2,375 | 2,386 | 1,902 | 3,332 | 1,431 | 2,858 | 2,394 | 1,900 | 949 |
| 2016 | 1,815 | 3,758 | 1,875 | 2,881 | 3,315 | 2,096 | 1,995 | 1,904 | 949 | 1,901 | 947 | 951 |
| 2017 | 951 | 902 | 6 | 1,330 | 1,902 | 1,066 | 2,809 | 1,497 | ||||
| 2018 | 2,597 | 470 | 1,386 | 952 | 950 | 955 | ||||||
| 2019 | 477 | 472 | 476 | 476 | ||||||||
| 2023 | 543 | 403 | ||||||||||
| 2024 | 573 | |||||||||||
| - = No Data Reported; -- = Not Applicable; NA = Not Available; W = Withheld to avoid disclosure of individual company data. |
| Release Date: 3/29/2024 |
| Next Release Date: 4/30/2024 |