|
Download Data (XLS File) |
|
||||||||
|
||||||||
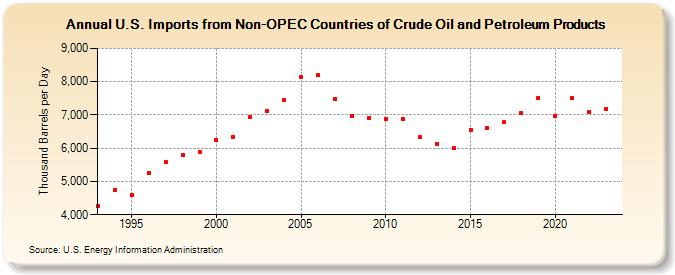
| U.S. Imports from Non-OPEC Countries of Crude Oil and Petroleum Products (Thousand Barrels per Day) | ||||||||
| Decade | Year-0 | Year-1 | Year-2 | Year-3 | Year-4 | Year-5 | Year-6 | Year-7 | Year-8 | Year-9 |
|---|---|---|---|---|---|---|---|---|---|---|
| 1990's | 4,266 | 4,749 | 4,604 | 5,267 | 5,593 | 5,803 | 5,899 | |||
| 2000's | 6,257 | 6,343 | 6,925 | 7,103 | 7,444 | 8,127 | 8,190 | 7,489 | 6,961 | 6,915 |
| 2010's | 6,887 | 6,881 | 6,327 | 6,138 | 6,004 | 6,554 | 6,610 | 6,778 | 7,055 | 7,502 |
| 2020's | 6,977 | 7,514 | 7,075 | 7,174 |
| - = No Data Reported; -- = Not Applicable; NA = Not Available; W = Withheld to avoid disclosure of individual company data. |
| Release Date: 3/29/2024 |
| Next Release Date: 8/30/2024 |