|
Download Data (XLS File) |
|
||||||||
|
||||||||
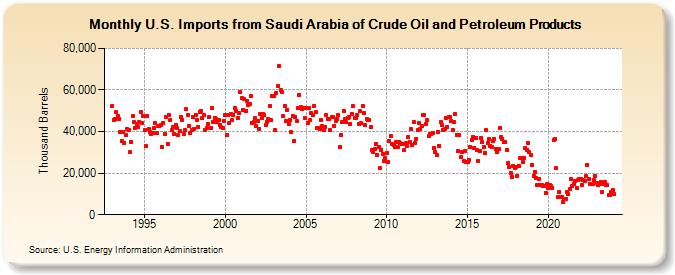
| U.S. Imports from Saudi Arabia of Crude Oil and Petroleum Products (Thousand Barrels) | ||||||||
| Year | Jan | Feb | Mar | Apr | May | Jun | Jul | Aug | Sep | Oct | Nov | Dec |
|---|---|---|---|---|---|---|---|---|---|---|---|---|
| 1993 | 52,313 | 45,531 | 45,859 | 49,323 | 47,249 | 46,189 | 39,781 | 35,691 | 39,880 | 34,552 | 38,415 | 41,226 |
| 1994 | 40,933 | 29,975 | 35,102 | 47,592 | 44,579 | 41,855 | 43,824 | 42,247 | 44,582 | 49,616 | 44,306 | 47,300 |
| 1995 | 40,592 | 33,076 | 47,597 | 41,261 | 39,725 | 38,597 | 39,223 | 41,554 | 44,223 | 39,068 | 42,858 | 42,713 |
| 1996 | 43,335 | 32,725 | 44,078 | 38,626 | 47,059 | 34,145 | 47,979 | 45,775 | 40,650 | 42,072 | 38,899 | 43,387 |
| 1997 | 41,673 | 38,117 | 40,045 | 47,180 | 45,737 | 38,981 | 40,688 | 50,723 | 47,969 | 42,702 | 39,226 | 40,652 |
| 1998 | 46,977 | 41,147 | 48,116 | 45,797 | 42,233 | 49,405 | 50,069 | 46,498 | 48,193 | 40,807 | 41,587 | 43,472 |
| 1999 | 46,851 | 41,922 | 51,206 | 44,463 | 46,559 | 46,155 | 44,531 | 45,694 | 43,234 | 41,954 | 41,887 | 45,106 |
| 2000 | 47,833 | 38,204 | 47,993 | 43,982 | 48,554 | 45,365 | 48,167 | 51,122 | 50,066 | 46,455 | 48,726 | 58,807 |
| 2001 | 55,910 | 50,397 | 55,427 | 49,743 | 54,885 | 52,918 | 53,106 | 56,894 | 44,344 | 44,393 | 46,280 | 42,456 |
| 2002 | 45,124 | 41,259 | 48,306 | 46,688 | 48,470 | 47,929 | 43,163 | 44,779 | 45,931 | 52,389 | 45,335 | 57,139 |
| 2003 | 57,066 | 40,512 | 58,466 | 62,085 | 71,461 | 60,054 | 58,896 | 47,581 | 52,463 | 44,966 | 50,416 | 43,700 |
| 2004 | 45,792 | 39,712 | 47,472 | 35,301 | 47,093 | 44,940 | 51,295 | 57,801 | 51,964 | 51,022 | 51,198 | 46,547 |
| 2005 | 51,257 | 44,064 | 51,169 | 45,425 | 48,992 | 47,891 | 52,453 | 49,274 | 41,689 | 41,884 | 41,099 | 45,626 |
| 2006 | 42,432 | 40,630 | 42,272 | 47,836 | 46,241 | 45,866 | 40,712 | 46,933 | 46,918 | 42,856 | 45,218 | 46,229 |
| 2007 | 47,800 | 32,573 | 38,557 | 44,628 | 50,020 | 46,009 | 44,529 | 46,463 | 46,798 | 43,744 | 48,595 | 52,271 |
| 2008 | 46,581 | 46,632 | 47,806 | 43,867 | 49,719 | 43,924 | 52,389 | 48,759 | 42,942 | 46,104 | 45,428 | 45,599 |
| 2009 | 42,222 | 31,290 | 29,981 | 31,698 | 34,150 | 28,759 | 32,430 | 22,585 | 31,340 | 29,233 | 25,737 | 27,180 |
| 2010 | 29,856 | 25,148 | 35,615 | 37,706 | 33,994 | 33,743 | 32,641 | 35,078 | 32,804 | 35,073 | 34,573 | 33,896 |
| 2011 | 34,126 | 31,197 | 34,356 | 33,204 | 37,290 | 35,059 | 41,110 | 33,331 | 44,370 | 34,714 | 36,658 | 40,605 |
| 2012 | 44,103 | 41,181 | 42,439 | 47,901 | 47,730 | 43,683 | 45,448 | 37,816 | 38,744 | 39,011 | 39,487 | 32,052 |
| 2013 | 30,347 | 28,887 | 39,796 | 33,269 | 44,632 | 42,928 | 40,870 | 41,290 | 46,701 | 42,211 | 46,893 | 47,110 |
| 2014 | 45,311 | 40,986 | 44,765 | 48,218 | 38,476 | 30,504 | 38,198 | 27,802 | 30,157 | 25,741 | 30,421 | 25,190 |
| 2015 | 25,418 | 26,458 | 32,472 | 36,147 | 37,518 | 32,324 | 36,806 | 31,166 | 25,876 | 30,480 | 37,073 | 34,767 |
| 2016 | 32,674 | 29,827 | 40,581 | 34,618 | 36,313 | 33,105 | 32,633 | 35,559 | 36,315 | 31,781 | 30,076 | 31,443 |
| 2017 | 41,696 | 37,476 | 36,351 | 34,812 | 35,086 | 31,347 | 24,637 | 22,922 | 20,272 | 18,321 | 23,399 | 22,302 |
| 2018 | 23,067 | 18,679 | 23,565 | 27,115 | 27,039 | 25,419 | 27,143 | 32,220 | 31,296 | 34,342 | 30,028 | 28,823 |
| 2019 | 24,080 | 18,569 | 20,645 | 17,496 | 14,334 | 17,358 | 14,060 | 14,299 | 13,727 | 13,766 | 10,662 | 14,560 |
| 2020 | 12,632 | 14,194 | 13,808 | 12,881 | 35,905 | 36,630 | 22,271 | 8,471 | 10,980 | 8,676 | 8,580 | 5,901 |
| 2021 | 7,362 | 7,513 | 10,868 | 9,924 | 12,240 | 17,316 | 14,016 | 14,599 | 16,395 | 12,997 | 16,640 | 17,039 |
| 2022 | 17,139 | 14,493 | 16,630 | 16,104 | 18,430 | 24,049 | 17,131 | 14,967 | 14,990 | 14,889 | 16,577 | 18,763 |
| 2023 | 15,419 | 14,342 | 14,986 | 15,773 | 11,049 | 14,537 | 15,926 | 14,199 | 14,080 | 9,512 | 9,554 | 10,899 |
| 2024 | 11,981 | |||||||||||
| - = No Data Reported; -- = Not Applicable; NA = Not Available; W = Withheld to avoid disclosure of individual company data. |
| Release Date: 3/29/2024 |
| Next Release Date: 4/30/2024 |