|
Download Data (XLS File) |
|
||||||||
|
||||||||
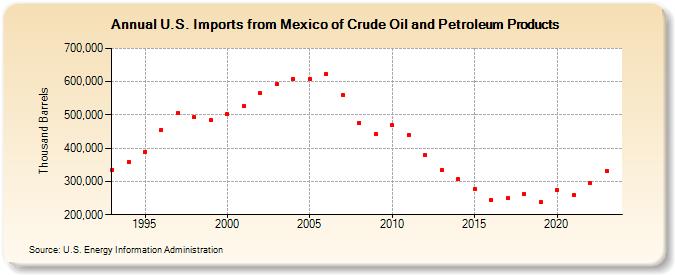
| U.S. Imports from Mexico of Crude Oil and Petroleum Products (Thousand Barrels) | ||||||||
| Decade | Year-0 | Year-1 | Year-2 | Year-3 | Year-4 | Year-5 | Year-6 | Year-7 | Year-8 | Year-9 |
|---|---|---|---|---|---|---|---|---|---|---|
| 1990's | 335,283 | 359,134 | 389,667 | 455,406 | 505,610 | 493,165 | 483,385 | |||
| 2000's | 502,509 | 525,557 | 564,497 | 592,466 | 609,225 | 606,751 | 622,408 | 559,304 | 476,366 | 441,648 |
| 2010's | 468,830 | 440,252 | 378,692 | 335,313 | 307,276 | 276,595 | 244,895 | 249,060 | 262,613 | 237,390 |
| 2020's | 274,757 | 259,500 | 294,883 | 332,254 |
| - = No Data Reported; -- = Not Applicable; NA = Not Available; W = Withheld to avoid disclosure of individual company data. |
| Release Date: 8/30/2024 |
| Next Release Date: 8/29/2025 |