|
Download Data (XLS File) |
|
||||||||
|
||||||||
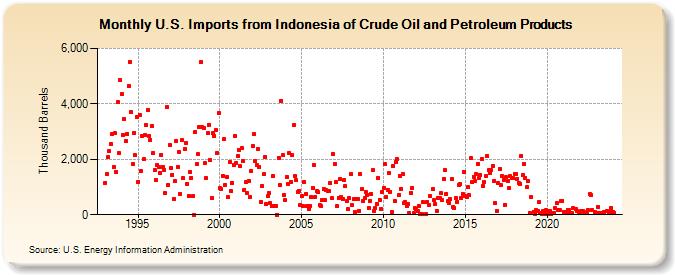
| U.S. Imports from Indonesia of Crude Oil and Petroleum Products (Thousand Barrels) | ||||||||
| Year | Jan | Feb | Mar | Apr | May | Jun | Jul | Aug | Sep | Oct | Nov | Dec |
|---|---|---|---|---|---|---|---|---|---|---|---|---|
| 1993 | 1,155 | 1,456 | 2,086 | 2,284 | 2,555 | 2,897 | 1,717 | 2,936 | 1,525 | 4,050 | 2,219 | 4,849 |
| 1994 | 4,352 | 2,870 | 3,457 | 2,653 | 2,923 | 4,636 | 5,524 | 3,690 | 1,829 | 2,965 | 2,143 | 3,517 |
| 1995 | 1,192 | 3,609 | 1,574 | 2,839 | 2,009 | 2,891 | 3,221 | 3,795 | 2,831 | 2,704 | 3,202 | 2,231 |
| 1996 | 1,612 | 1,266 | 1,793 | 1,722 | 1,521 | 2,167 | 1,735 | 1,631 | 768 | 3,871 | 1,073 | 2,511 |
| 1997 | 1,696 | 1,441 | 569 | 1,202 | 2,670 | 1,723 | 2,273 | 742 | 2,688 | 1,317 | 2,362 | 2,598 |
| 1998 | 1,117 | 669 | 1,549 | 1,329 | 658 | 0 | 2,984 | 1,828 | 2,180 | 3,174 | 5,504 | 3,161 |
| 1999 | 3,112 | 1,859 | 1,320 | 2,935 | 3,243 | 1,966 | 596 | 2,931 | 2,846 | 3,041 | 2,229 | 3,655 |
| 2000 | 948 | 929 | 1,397 | 2,716 | 1,085 | 1,367 | 626 | 1,894 | 850 | 1,155 | 1,796 | 2,841 |
| 2001 | 1,878 | 2,131 | 2,352 | 1,746 | 2,407 | 1,944 | 904 | 1,169 | 773 | 1,218 | 647 | 1,594 |
| 2002 | 2,467 | 2,905 | 1,953 | 1,806 | 2,371 | 1,716 | 453 | 1,053 | 1,459 | 2,094 | 381 | 662 |
| 2003 | 783 | 409 | 323 | 1,386 | 303 | 326 | 0 | 2,060 | 1,057 | 4,119 | 2,144 | 699 |
| 2004 | 520 | 1,371 | 1,108 | 2,216 | 1,198 | 2,161 | 3,233 | 1,388 | 1,243 | 822 | 863 | 352 |
| 2005 | 674 | 302 | 1,181 | 747 | 301 | 208 | 331 | 630 | 981 | 1,786 | 653 | 870 |
| 2006 | 818 | 334 | 319 | 515 | 927 | 521 | 885 | 849 | 862 | 1,152 | 586 | 2,199 |
| 2007 | 1,824 | 1,175 | 305 | 616 | 1,273 | 639 | 560 | 1,254 | 1,022 | 487 | 202 | 586 |
| 2008 | 1,461 | 337 | 551 | 111 | 576 | 582 | 143 | 1,462 | 920 | 502 | 595 | 828 |
| 2009 | 727 | 247 | 505 | 741 | 1,603 | 150 | 251 | 392 | 1,321 | 546 | 218 | 823 |
| 2010 | 977 | 1,816 | 637 | 898 | 1,510 | 836 | 108 | 1,770 | 500 | 1,905 | 1,998 | 705 |
| 2011 | 1,412 | 936 | 1,469 | 425 | 458 | 308 | 398 | 57 | 797 | 974 | 61 | 232 |
| 2012 | 189 | 133 | 324 | 23 | 23 | 441 | 23 | 468 | 368 | 658 | ||
| 2013 | 913 | 538 | 386 | 144 | 616 | 599 | 766 | 538 | 1,292 | 1,602 | 764 | 490 |
| 2014 | 435 | 549 | 1,297 | 289 | 233 | 608 | 476 | 1,077 | 1,116 | 620 | 757 | 1,550 |
| 2015 | 671 | 634 | 991 | 696 | 2,032 | 1,169 | 1,376 | 1,213 | 1,467 | 1,846 | 1,330 | 1,441 |
| 2016 | 2,024 | 1,053 | 1,172 | 1,383 | 2,115 | 1,598 | 1,493 | 1,601 | 1,757 | 1,210 | 418 | 140 |
| 2017 | 1,149 | 1,665 | 1,063 | 1,391 | 1,256 | 360 | 1,348 | 1,210 | 961 | 1,386 | 1,317 | 1,323 |
| 2018 | 1,464 | 1,482 | 1,305 | 1,156 | 1,124 | 2,127 | 1,445 | 1,821 | 1,340 | 982 | 1,204 | 76 |
| 2019 | 637 | 108 | 36 | 154 | 125 | 445 | 50 | 40 | 124 | 13 | 168 | |
| 2020 | 128 | 15 | 121 | 30 | 59 | 71 | 227 | 405 | 174 | 171 | 511 | 507 |
| 2021 | 91 | 76 | 92 | 182 | 158 | 59 | 59 | 251 | 202 | 134 | 67 | |
| 2022 | 63 | 145 | 123 | 112 | 61 | 52 | 169 | 743 | 702 | 167 | 93 | |
| 2023 | 57 | 288 | 75 | 60 | 56 | 75 | 112 | 133 | 52 | 90 | 238 | |
| 2024 | 109 | |||||||||||
| - = No Data Reported; -- = Not Applicable; NA = Not Available; W = Withheld to avoid disclosure of individual company data. |
| Release Date: 3/29/2024 |
| Next Release Date: 4/30/2024 |