|
Download Data (XLS File) |
|
||||||||
|
||||||||
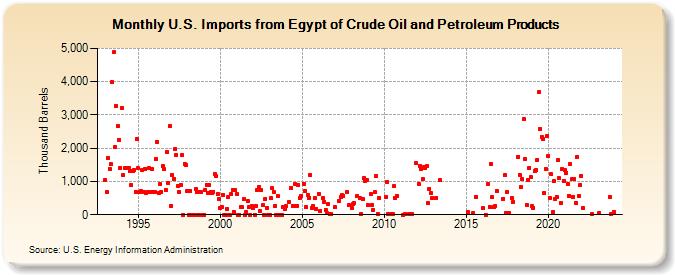
| U.S. Imports from Egypt of Crude Oil and Petroleum Products (Thousand Barrels) | ||||||||
| Year | Jan | Feb | Mar | Apr | May | Jun | Jul | Aug | Sep | Oct | Nov | Dec |
|---|---|---|---|---|---|---|---|---|---|---|---|---|
| 1993 | 1,043 | 687 | 1,714 | 1,375 | 1,512 | 3,984 | 4,877 | 2,044 | 3,280 | 2,677 | 2,260 | 1,405 |
| 1994 | 3,213 | 1,195 | 1,408 | 1,395 | 1,409 | 1,403 | 1,300 | 885 | 1,322 | 1,358 | 697 | 2,269 |
| 1995 | 1,393 | 693 | 698 | 1,359 | 692 | 1,388 | 659 | 687 | 1,393 | 688 | 1,378 | 692 |
| 1996 | 688 | 1,674 | 2,195 | 660 | 926 | 696 | 1,468 | 1,360 | 752 | 1,894 | 950 | 2,660 |
| 1997 | 255 | 1,188 | 1,081 | 1,977 | 1,809 | 872 | 670 | 900 | 1,794 | 0 | 1,539 | 1,487 |
| 1998 | 705 | 0 | 719 | 0 | 0 | 0 | 768 | 695 | 0 | 690 | 681 | 0 |
| 1999 | 0 | 746 | 902 | 654 | 888 | 684 | 652 | 678 | 1,221 | 1,150 | 624 | 461 |
| 2000 | 202 | 238 | 603 | 0 | 0 | 180 | 540 | 0 | 610 | 744 | 96 | 730 |
| 2001 | 621 | 0 | 0 | 240 | 232 | 469 | 0 | 79 | 422 | 221 | 0 | 268 |
| 2002 | 199 | 0 | 271 | 753 | 835 | 103 | 730 | 278 | 0 | 485 | 213 | 0 |
| 2003 | 0 | 490 | 792 | 693 | 257 | 0 | 557 | 0 | 0 | 0 | 236 | 168 |
| 2004 | 247 | 382 | 812 | 273 | 263 | 929 | 277 | 908 | 502 | 554 | ||
| 2005 | 934 | 720 | 239 | 579 | 512 | 1,194 | 211 | 267 | 500 | 186 | ||
| 2006 | 627 | 115 | 511 | 393 | 154 | 43 | 318 | 10 | 23 | |||
| 2007 | 230 | 416 | 529 | 582 | 574 | 681 | 278 | |||||
| 2008 | 193 | 321 | 357 | 562 | 515 | 36 | 460 | 1,090 | 1,021 | 1,050 | ||
| 2009 | 281 | 622 | 300 | 151 | 672 | 1,161 | 22 | 517 | ||||
| 2010 | 547 | 998 | 22 | 22 | 22 | 853 | 501 | 572 | ||||
| 2011 | 1 | 14 | 23 | 26 | 9 | 1,543 | ||||||
| 2012 | 934 | 1,477 | 1,389 | 1,059 | 1,428 | 1,417 | 1,476 | 347 | 776 | 645 | 508 | |
| 2013 | 513 | 1,040 | ||||||||||
| 2015 | 96 | 56 | 542 | |||||||||
| 2016 | 199 | 1 | 918 | 245 | 1,529 | 535 | 221 | 263 | 714 | |||
| 2017 | 487 | 1,193 | 66 | 686 | 46 | 497 | 384 | |||||
| 2018 | 1,749 | 1,203 | 841 | 1,073 | 2,875 | 1,678 | 304 | 1,052 | 1,405 | 1,129 | ||
| 2019 | 248 | 200 | 1,310 | 1,355 | 1,656 | 3,678 | 2,591 | 2,338 | 2,277 | 654 | 1,378 | 2,381 |
| 2020 | 1,759 | 515 | 1,211 | 80 | 1,019 | 487 | 547 | 1,643 | 1,096 | 357 | 1,378 | 1,027 |
| 2021 | 1,330 | 1,269 | 912 | 571 | 1,512 | 1,066 | 546 | 1,069 | 361 | 1,737 | 570 | 903 |
| 2022 | 1,178 | 215 | 22 | |||||||||
| 2023 | 47 | 534 | 34 | |||||||||
| 2024 | 82 | |||||||||||
| - = No Data Reported; -- = Not Applicable; NA = Not Available; W = Withheld to avoid disclosure of individual company data. |
| Release Date: 3/29/2024 |
| Next Release Date: 4/30/2024 |