|
Download Data (XLS File) |
|
||||||||
|
||||||||
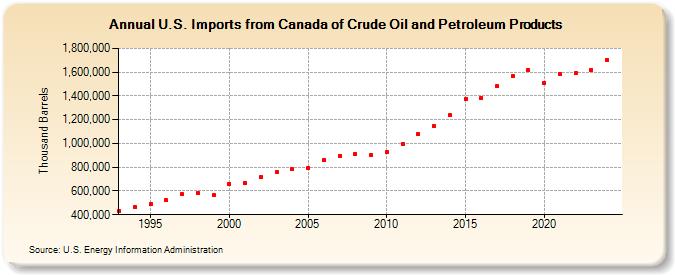
| U.S. Imports from Canada of Crude Oil and Petroleum Products (Thousand Barrels) | ||||||||
| Decade | Year-0 | Year-1 | Year-2 | Year-3 | Year-4 | Year-5 | Year-6 | Year-7 | Year-8 | Year-9 |
|---|---|---|---|---|---|---|---|---|---|---|
| 1990's | 431,182 | 464,317 | 486,230 | 521,101 | 570,602 | 583,428 | 561,881 | |||
| 2000's | 661,351 | 667,374 | 719,334 | 756,354 | 782,598 | 796,219 | 858,839 | 895,976 | 912,263 | 904,914 |
| 2010's | 925,428 | 996,008 | 1,078,412 | 1,146,702 | 1,236,459 | 1,374,189 | 1,383,506 | 1,479,874 | 1,566,500 | 1,617,636 |
| 2020's | 1,509,646 | 1,584,210 | 1,593,250 | 1,614,475 |
| - = No Data Reported; -- = Not Applicable; NA = Not Available; W = Withheld to avoid disclosure of individual company data. |
| Release Date: 3/29/2024 |
| Next Release Date: 8/30/2024 |