|
Download Data (XLS File) |
|
||||||||
|
||||||||
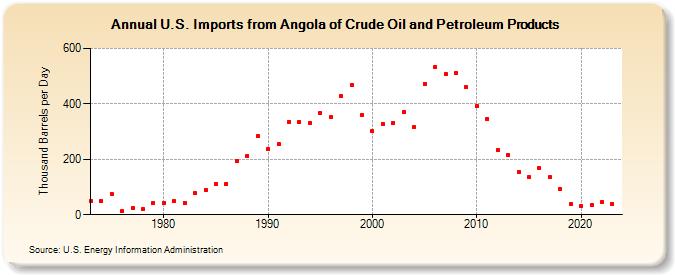
| U.S. Imports from Angola of Crude Oil and Petroleum Products (Thousand Barrels per Day) | ||||||||
| Decade | Year-0 | Year-1 | Year-2 | Year-3 | Year-4 | Year-5 | Year-6 | Year-7 | Year-8 | Year-9 |
|---|---|---|---|---|---|---|---|---|---|---|
| 1970's | 49 | 49 | 75 | 12 | 24 | 20 | 43 | |||
| 1980's | 42 | 49 | 44 | 78 | 90 | 110 | 112 | 192 | 212 | 284 |
| 1990's | 237 | 254 | 336 | 336 | 331 | 367 | 351 | 427 | 468 | 361 |
| 2000's | 301 | 328 | 332 | 371 | 316 | 473 | 534 | 508 | 513 | 460 |
| 2010's | 393 | 346 | 233 | 216 | 154 | 136 | 168 | 135 | 94 | 38 |
| 2020's | 31 | 36 | 47 | 40 |
| - = No Data Reported; -- = Not Applicable; NA = Not Available; W = Withheld to avoid disclosure of individual company data. |
| Release Date: 3/29/2024 |
| Next Release Date: 8/30/2024 |