|
Download Data (XLS File) |
|
||||||||
|
||||||||
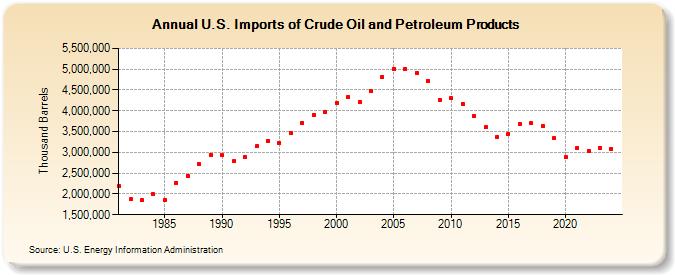
| U.S. Imports of Crude Oil and Petroleum Products (Thousand Barrels) | ||||||||
| Decade | Year-0 | Year-1 | Year-2 | Year-3 | Year-4 | Year-5 | Year-6 | Year-7 | Year-8 | Year-9 |
|---|---|---|---|---|---|---|---|---|---|---|
| 1980's | 2,188,420 | 1,866,358 | 1,843,744 | 1,989,935 | 1,849,508 | 2,271,582 | 2,437,359 | 2,709,140 | 2,942,099 | |
| 1990's | 2,926,395 | 2,783,763 | 2,886,897 | 3,146,454 | 3,283,621 | 3,224,753 | 3,469,128 | 3,708,970 | 3,908,446 | 3,961,074 |
| 2000's | 4,194,086 | 4,333,038 | 4,208,538 | 4,476,501 | 4,811,104 | 5,005,541 | 5,003,082 | 4,915,957 | 4,726,994 | 4,267,110 |
| 2010's | 4,304,533 | 4,174,210 | 3,878,852 | 3,598,454 | 3,372,904 | 3,448,734 | 3,680,227 | 3,702,640 | 3,629,042 | 3,336,563 |
| 2020's | 2,877,890 | 3,092,978 | 3,040,020 | 3,107,571 |
| - = No Data Reported; -- = Not Applicable; NA = Not Available; W = Withheld to avoid disclosure of individual company data. |
| Release Date: 3/29/2024 |
| Next Release Date: 8/30/2024 |