|
Download Data (XLS File) |
|
||||||||
|
||||||||
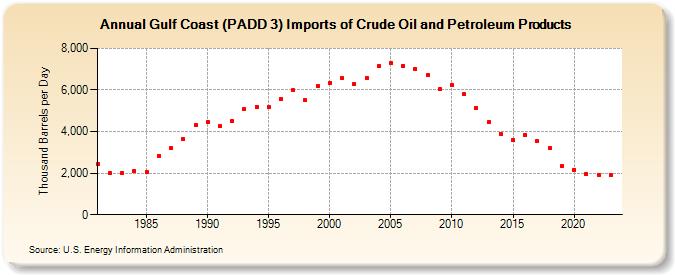
| Gulf Coast (PADD 3) Imports of Crude Oil and Petroleum Products (Thousand Barrels per Day) | ||||||||
| Decade | Year-0 | Year-1 | Year-2 | Year-3 | Year-4 | Year-5 | Year-6 | Year-7 | Year-8 | Year-9 |
|---|---|---|---|---|---|---|---|---|---|---|
| 1980's | 2,430 | 1,993 | 2,000 | 2,101 | 2,061 | 2,847 | 3,202 | 3,625 | 4,311 | |
| 1990's | 4,463 | 4,245 | 4,492 | 5,063 | 5,202 | 5,163 | 5,583 | 5,982 | 5,503 | 6,211 |
| 2000's | 6,334 | 6,583 | 6,288 | 6,579 | 7,134 | 7,295 | 7,167 | 7,004 | 6,722 | 6,028 |
| 2010's | 6,247 | 5,806 | 5,124 | 4,450 | 3,865 | 3,585 | 3,853 | 3,523 | 3,201 | 2,347 |
| 2020's | 2,165 | 1,957 | 1,930 | 1,924 |
| - = No Data Reported; -- = Not Applicable; NA = Not Available; W = Withheld to avoid disclosure of individual company data. |
| Release Date: 3/29/2024 |
| Next Release Date: 8/30/2024 |