|
Download Data (XLS File) |
|
||||||||
|
||||||||
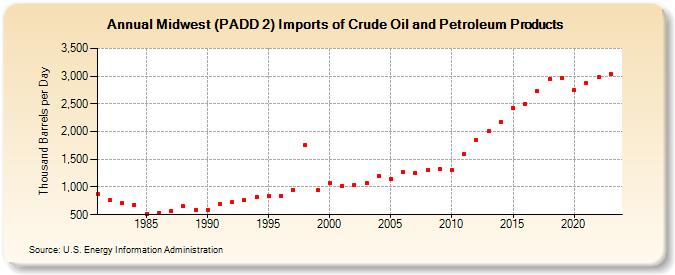
| Midwest (PADD 2) Imports of Crude Oil and Petroleum Products (Thousand Barrels per Day) | ||||||||
| Decade | Year-0 | Year-1 | Year-2 | Year-3 | Year-4 | Year-5 | Year-6 | Year-7 | Year-8 | Year-9 |
|---|---|---|---|---|---|---|---|---|---|---|
| 1980's | 872 | 767 | 711 | 676 | 518 | 531 | 574 | 651 | 587 | |
| 1990's | 593 | 695 | 730 | 761 | 823 | 843 | 846 | 952 | 1,758 | 938 |
| 2000's | 1,073 | 1,021 | 1,034 | 1,066 | 1,192 | 1,142 | 1,268 | 1,254 | 1,315 | 1,321 |
| 2010's | 1,314 | 1,594 | 1,839 | 2,003 | 2,177 | 2,430 | 2,502 | 2,725 | 2,945 | 2,972 |
| 2020's | 2,748 | 2,878 | 2,976 | 3,034 |
| - = No Data Reported; -- = Not Applicable; NA = Not Available; W = Withheld to avoid disclosure of individual company data. |
| Release Date: 3/29/2024 |
| Next Release Date: 8/30/2024 |