|
Download Data (XLS File) |
|
||||||||
|
||||||||
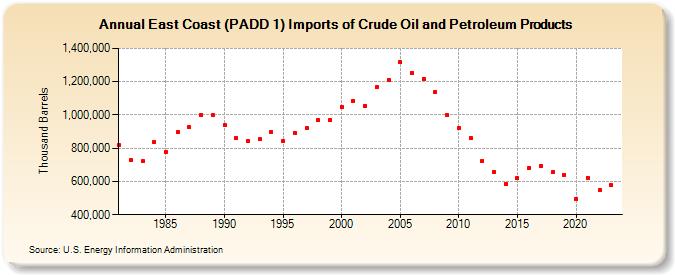
| East Coast (PADD 1) Imports of Crude Oil and Petroleum Products (Thousand Barrels) | ||||||||
| Decade | Year-0 | Year-1 | Year-2 | Year-3 | Year-4 | Year-5 | Year-6 | Year-7 | Year-8 | Year-9 |
|---|---|---|---|---|---|---|---|---|---|---|
| 1980's | 817,790 | 727,838 | 720,482 | 837,801 | 777,816 | 896,091 | 925,790 | 1,001,036 | 996,746 | |
| 1990's | 937,270 | 859,891 | 844,993 | 853,468 | 896,210 | 842,528 | 891,630 | 922,608 | 970,500 | 972,357 |
| 2000's | 1,048,451 | 1,082,866 | 1,055,682 | 1,165,761 | 1,212,023 | 1,316,138 | 1,254,739 | 1,216,266 | 1,140,687 | 1,000,500 |
| 2010's | 922,271 | 859,776 | 725,573 | 657,799 | 586,898 | 620,147 | 683,668 | 692,030 | 655,141 | 640,806 |
| 2020's | 493,369 | 623,333 | 545,774 | 576,997 |
| - = No Data Reported; -- = Not Applicable; NA = Not Available; W = Withheld to avoid disclosure of individual company data. |
| Release Date: 3/29/2024 |
| Next Release Date: 8/30/2024 |