|
Download Data (XLS File) |
|
||||||||
|
||||||||
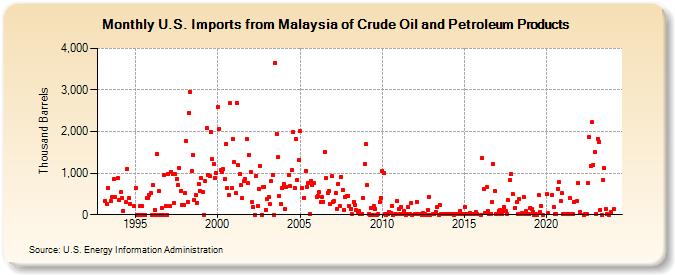
| U.S. Imports from Malaysia of Crude Oil and Petroleum Products (Thousand Barrels) | ||||||||
| Year | Jan | Feb | Mar | Apr | May | Jun | Jul | Aug | Sep | Oct | Nov | Dec |
|---|---|---|---|---|---|---|---|---|---|---|---|---|
| 1993 | 328 | 246 | 637 | 326 | 429 | 847 | 428 | 872 | ||||
| 1994 | 351 | 539 | 412 | 96 | 295 | 1,103 | 391 | 269 | 200 | |||
| 1995 | 646 | 0 | 0 | 201 | 0 | 199 | 0 | 0 | 407 | 405 | 472 | 515 |
| 1996 | 0 | 705 | 120 | 0 | 1,464 | 569 | 0 | 170 | 0 | 957 | 213 | 0 |
| 1997 | 988 | 208 | 1,037 | 988 | 291 | 973 | 861 | 713 | 1,117 | 579 | 230 | 229 |
| 1998 | 522 | 1,778 | 302 | 2,455 | 2,957 | 1,051 | 1,434 | 349 | 474 | 290 | 741 | 579 |
| 1999 | 881 | 557 | 0 | 810 | 2,083 | 944 | 943 | 1,996 | 1,329 | 1,224 | 893 | 1,003 |
| 2000 | 2,597 | 2,061 | 1,067 | 1,018 | 1,097 | 869 | 1,701 | 636 | 463 | 2,680 | 643 | 1,816 |
| 2001 | 1,268 | 513 | 2,687 | 1,184 | 968 | 705 | 397 | 818 | 869 | 1,822 | 755 | 1,447 |
| 2002 | 1,027 | 295 | 178 | 0 | 935 | 211 | 612 | 1,168 | 0 | 669 | 675 | 123 |
| 2003 | 386 | 425 | 249 | 799 | 959 | 0 | 3,658 | 1,936 | 1,380 | 455 | 256 | 649 |
| 2004 | 741 | 135 | 667 | 966 | 685 | 1,068 | 1,988 | 641 | 1,832 | 842 | 1,310 | |
| 2005 | 2,009 | 651 | 409 | 1,055 | 673 | 767 | 8 | 814 | 707 | 756 | ||
| 2006 | 426 | 441 | 546 | 303 | 418 | 317 | 1,513 | 877 | 517 | 566 | 264 | 922 |
| 2007 | 317 | 320 | 530 | 133 | 749 | 205 | 910 | 603 | 119 | 417 | 443 | 461 |
| 2008 | 215 | 139 | 10 | 312 | 237 | 108 | 31 | 82 | 18 | 29 | 406 | 1,219 |
| 2009 | 1,696 | 714 | 15 | 1 | 155 | 3 | 206 | 140 | 5 | 20 | 295 | 409 |
| 2010 | 1,053 | 1,013 | 7 | 1 | 24 | 68 | 36 | 219 | 5 | 22 | 15 | 319 |
| 2011 | 132 | 6 | 194 | 9 | 90 | 3 | 9 | 182 | 11 | 285 | 1 | |
| 2012 | 14 | 314 | 14 | 7 | 9 | 3 | 31 | 13 | 4 | 117 | 432 | 1 |
| 2013 | 8 | 8 | 77 | 183 | 4 | 243 | 7 | 22 | 6 | 6 | 6 | |
| 2014 | 8 | 16 | 12 | 6 | 5 | 29 | 6 | 7 | 6 | 94 | 22 | 13 |
| 2015 | 191 | 21 | 6 | 17 | 40 | 7 | 23 | 26 | 74 | 6 | ||
| 2016 | 2 | 1,358 | 621 | 48 | 659 | 88 | 9 | 9 | 312 | 1,227 | 565 | 10 |
| 2017 | 12 | 97 | 124 | 8 | 82 | 180 | 85 | 21 | 346 | 830 | 973 | 500 |
| 2018 | 163 | 299 | 24 | 381 | 12 | 33 | 423 | 10 | 83 | 7 | 18 | |
| 2019 | 172 | 139 | 74 | 4 | 21 | 3 | 470 | 60 | 210 | 3 | ||
| 2020 | 490 | 33 | 486 | 190 | 8 | 15 | 630 | 780 | 327 | 514 | ||
| 2021 | 18 | 22 | 12 | 20 | 18 | 392 | 10 | 6 | 315 | 318 | 767 | |
| 2022 | 65 | 4 | 13 | 26 | 754 | 1,859 | 1,177 | 2,226 | 1,202 | 1,499 | ||
| 2023 | 27 | 1,823 | 1,757 | 123 | 4 | 839 | 1,116 | 138 | 6 | 1 | 61 | |
| - = No Data Reported; -- = Not Applicable; NA = Not Available; W = Withheld to avoid disclosure of individual company data. |
| Release Date: 3/29/2024 |
| Next Release Date: 4/30/2024 |