|
Download Data (XLS File) |
|
||||||||
|
||||||||
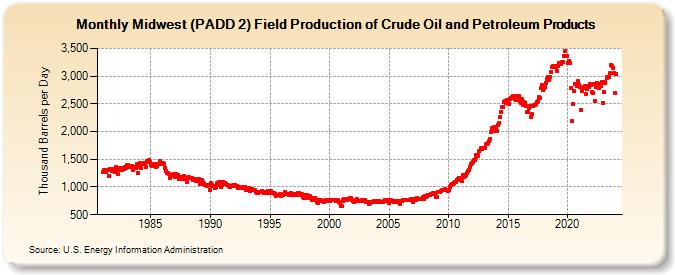
| Midwest (PADD 2) Field Production of Crude Oil and Petroleum Products (Thousand Barrels per Day) | ||||||||
| Year | Jan | Feb | Mar | Apr | May | Jun | Jul | Aug | Sep | Oct | Nov | Dec |
|---|---|---|---|---|---|---|---|---|---|---|---|---|
| 1981 | 1,275 | 1,314 | 1,294 | 1,273 | 1,306 | 1,311 | 1,206 | 1,322 | 1,319 | 1,286 | 1,328 | 1,329 |
| 1982 | 1,276 | 1,364 | 1,311 | 1,228 | 1,315 | 1,348 | 1,303 | 1,309 | 1,347 | 1,333 | 1,364 | 1,335 |
| 1983 | 1,393 | 1,392 | 1,356 | 1,358 | 1,354 | 1,386 | 1,308 | 1,366 | 1,355 | 1,347 | 1,418 | 1,260 |
| 1984 | 1,353 | 1,425 | 1,337 | 1,416 | 1,419 | 1,435 | 1,428 | 1,359 | 1,461 | 1,457 | 1,484 | 1,446 |
| 1985 | 1,391 | 1,386 | 1,401 | 1,408 | 1,422 | 1,369 | 1,381 | 1,416 | 1,409 | 1,465 | 1,422 | 1,422 |
| 1986 | 1,436 | 1,418 | 1,336 | 1,293 | 1,254 | 1,258 | 1,235 | 1,164 | 1,196 | 1,211 | 1,208 | 1,243 |
| 1987 | 1,185 | 1,233 | 1,194 | 1,222 | 1,144 | 1,169 | 1,172 | 1,148 | 1,162 | 1,191 | 1,179 | 1,153 |
| 1988 | 1,087 | 1,158 | 1,175 | 1,168 | 1,166 | 1,165 | 1,120 | 1,143 | 1,136 | 1,111 | 1,113 | 1,125 |
| 1989 | 1,142 | 1,048 | 1,114 | 1,121 | 1,093 | 1,053 | 1,043 | 1,030 | 1,022 | 1,028 | 1,032 | 945 |
| 1990 | 1,079 | 1,032 | 1,024 | 1,011 | 1,010 | 982 | 1,004 | 1,065 | 1,038 | 1,086 | 1,086 | 1,000 |
| 1991 | 1,033 | 1,088 | 1,068 | 1,068 | 1,060 | 1,032 | 1,039 | 1,021 | 994 | 1,017 | 1,024 | 1,029 |
| 1992 | 1,036 | 1,027 | 1,018 | 1,024 | 984 | 995 | 973 | 977 | 981 | 998 | 974 | 1,008 |
| 1993 | 948 | 951 | 987 | 989 | 922 | 966 | 955 | 942 | 939 | 943 | 917 | 886 |
| 1994 | 886 | 901 | 917 | 913 | 928 | 916 | 889 | 894 | 903 | 885 | 919 | 914 |
| 1995 | 898 | 923 | 892 | 896 | 884 | 870 | 845 | 862 | 847 | 856 | 868 | 840 |
| 1996 | 854 | 849 | 872 | 903 | 881 | 868 | 867 | 862 | 876 | 887 | 848 | 871 |
| 1997 | 856 | 869 | 876 | 864 | 889 | 886 | 878 | 857 | 866 | 826 | 797 | 848 |
| 1998 | 841 | 852 | 793 | 846 | 837 | 799 | 771 | 795 | 795 | 800 | 771 | 721 |
| 1999 | 713 | 758 | 739 | 761 | 743 | 753 | 738 | 744 | 759 | 741 | 758 | 751 |
| 2000 | 744 | 766 | 773 | 760 | 769 | 762 | 742 | 761 | 758 | 728 | 720 | 661 |
| 2001 | 661 | 744 | 770 | 782 | 783 | 787 | 768 | 777 | 780 | 796 | 795 | 757 |
| 2002 | 740 | 735 | 756 | 772 | 778 | 744 | 744 | 752 | 755 | 768 | 770 | 742 |
| 2003 | 759 | 732 | 721 | 722 | 694 | 704 | 730 | 726 | 729 | 749 | 736 | 745 |
| 2004 | 739 | 730 | 750 | 737 | 738 | 725 | 736 | 752 | 765 | 754 | 754 | 770 |
| 2005 | 718 | 759 | 765 | 751 | 744 | 728 | 741 | 722 | 754 | 740 | 748 | 692 |
| 2006 | 750 | 746 | 758 | 761 | 773 | 770 | 760 | 764 | 767 | 767 | 783 | 778 |
| 2007 | 726 | 759 | 788 | 772 | 796 | 775 | 792 | 777 | 791 | 777 | 819 | 792 |
| 2008 | 831 | 811 | 841 | 853 | 855 | 857 | 865 | 870 | 891 | 886 | 882 | 823 |
| 2009 | 828 | 910 | 918 | 914 | 926 | 941 | 938 | 938 | 959 | 943 | 954 | 934 |
| 2010 | 941 | 997 | 1,038 | 1,058 | 1,056 | 1,075 | 1,084 | 1,094 | 1,132 | 1,141 | 1,159 | 1,141 |
| 2011 | 1,134 | 1,109 | 1,208 | 1,180 | 1,203 | 1,216 | 1,255 | 1,286 | 1,300 | 1,367 | 1,417 | 1,429 |
| 2012 | 1,457 | 1,493 | 1,491 | 1,535 | 1,585 | 1,574 | 1,563 | 1,645 | 1,680 | 1,712 | 1,692 | 1,703 |
| 2013 | 1,698 | 1,708 | 1,773 | 1,783 | 1,800 | 1,831 | 1,869 | 1,997 | 2,062 | 2,066 | 2,088 | 2,008 |
| 2014 | 2,042 | 2,016 | 2,126 | 2,151 | 2,269 | 2,353 | 2,434 | 2,441 | 2,534 | 2,555 | 2,515 | 2,566 |
| 2015 | 2,542 | 2,505 | 2,587 | 2,611 | 2,629 | 2,648 | 2,618 | 2,584 | 2,574 | 2,647 | 2,621 | 2,646 |
| 2016 | 2,558 | 2,524 | 2,580 | 2,484 | 2,525 | 2,521 | 2,461 | 2,357 | 2,353 | 2,416 | 2,468 | 2,266 |
| 2017 | 2,310 | 2,463 | 2,480 | 2,487 | 2,490 | 2,538 | 2,547 | 2,623 | 2,606 | 2,777 | 2,836 | 2,751 |
| 2018 | 2,777 | 2,797 | 2,869 | 2,950 | 2,980 | 2,928 | 2,991 | 3,081 | 3,166 | 3,182 | 3,166 | 3,191 |
| 2019 | 3,171 | 3,098 | 3,184 | 3,234 | 3,219 | 3,224 | 3,251 | 3,263 | 3,358 | 3,454 | 3,356 | 3,366 |
| 2020 | 3,233 | 3,269 | 3,235 | 2,787 | 2,188 | 2,499 | 2,737 | 2,864 | 2,859 | 2,830 | 2,910 | 2,831 |
| 2021 | 2,801 | 2,387 | 2,735 | 2,783 | 2,797 | 2,816 | 2,676 | 2,768 | 2,819 | 2,810 | 2,849 | 2,845 |
| 2022 | 2,706 | 2,687 | 2,861 | 2,557 | 2,804 | 2,871 | 2,817 | 2,785 | 2,861 | 2,820 | 2,888 | 2,515 |
| 2023 | 2,716 | 2,870 | 2,886 | 2,958 | 2,990 | 2,985 | 2,990 | 3,051 | 3,204 | 3,178 | 3,150 | 3,068 |
| 2024 | 2,701 | |||||||||||
| - = No Data Reported; -- = Not Applicable; NA = Not Available; W = Withheld to avoid disclosure of individual company data. |
| Release Date: 3/29/2024 |
| Next Release Date: 4/30/2024 |