|
Download Data (XLS File) |
|
||||||||
|
||||||||
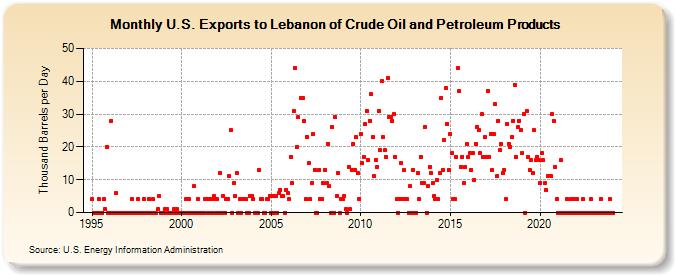
| U.S. Exports to Lebanon of Crude Oil and Petroleum Products (Thousand Barrels per Day) | ||||||||
| Year | Jan | Feb | Mar | Apr | May | Jun | Jul | Aug | Sep | Oct | Nov | Dec |
|---|---|---|---|---|---|---|---|---|---|---|---|---|
| 1995 | 4 | 0 | 0 | 0 | 0 | 4 | 0 | 0 | 4 | 1 | 20 | 0 |
| 1996 | 0 | 28 | 0 | 0 | 6 | 0 | 0 | 0 | 0 | 0 | 0 | 0 |
| 1997 | 0 | 0 | 0 | 4 | 0 | 0 | 0 | 4 | 0 | 0 | 0 | 4 |
| 1998 | 0 | 0 | 4 | 0 | 0 | 4 | 0 | 0 | 1 | 5 | 0 | 0 |
| 1999 | 0 | 1 | 1 | 0 | 0 | 0 | 0 | 1 | 0 | 1 | 0 | 0 |
| 2000 | 0 | 0 | 0 | 4 | 0 | 4 | 0 | 0 | 8 | 0 | 0 | 4 |
| 2001 | 0 | 0 | 0 | 0 | 4 | 4 | 0 | 4 | 0 | 4 | 5 | 0 |
| 2002 | 4 | 0 | 12 | 0 | 5 | 0 | 4 | 4 | 11 | 25 | 0 | 9 |
| 2003 | 5 | 12 | 0 | 4 | 0 | 4 | 4 | 4 | 0 | 0 | 5 | 5 |
| 2004 | 4 | 0 | 0 | 0 | 13 | 4 | 4 | 0 | 0 | 4 | 4 | 5 |
| 2005 | 0 | 5 | 0 | 5 | 0 | 6 | 7 | 5 | 5 | 0 | 7 | 6 |
| 2006 | 4 | 17 | 9 | 31 | 44 | 20 | 29 | 35 | 35 | 28 | 4 | |
| 2007 | 23 | 15 | 4 | 9 | 24 | 13 | 0 | 0 | 13 | 4 | 4 | 9 |
| 2008 | 13 | 9 | 21 | 8 | 0 | 26 | 0 | 29 | 5 | 12 | 0 | 4 |
| 2009 | 4 | 5 | 1 | 0 | 14 | 1 | 13 | 21 | 13 | 23 | 12 | 4 |
| 2010 | 24 | 15 | 17 | 27 | 31 | 16 | 28 | 36 | 23 | 11 | 16 | 14 |
| 2011 | 31 | 19 | 40 | 23 | 19 | 17 | 41 | 29 | 29 | 28 | 30 | 17 |
| 2012 | 4 | 0 | 4 | 15 | 4 | 13 | 4 | 4 | 0 | 8 | 0 | 13 |
| 2013 | 0 | 0 | 12 | 4 | 17 | 9 | 9 | 26 | 0 | 8 | 14 | 12 |
| 2014 | 9 | 5 | 4 | 10 | 4 | 12 | 35 | 13 | 22 | 38 | 27 | 13 |
| 2015 | 24 | 18 | 4 | 4 | 17 | 44 | 37 | 14 | 17 | 9 | 14 | 21 |
| 2016 | 17 | 18 | 13 | 18 | 10 | 21 | 26 | 25 | 18 | 30 | 17 | 23 |
| 2017 | 17 | 37 | 17 | 24 | 13 | 24 | 33 | 11 | 28 | 19 | 21 | 12 |
| 2018 | 13 | 4 | 27 | 21 | 20 | 23 | 28 | 39 | 17 | 26 | 28 | 25 |
| 2019 | 18 | 30 | 0 | 31 | 17 | 13 | 16 | 12 | 25 | 16 | 17 | 16 |
| 2020 | 9 | 18 | 16 | 9 | 7 | 11 | 11 | 11 | 30 | 28 | 14 | 4 |
| 2021 | 0 | 0 | 16 | 0 | 0 | 0 | 4 | 0 | 0 | 4 | 0 | 4 |
| 2022 | 0 | 4 | 0 | 0 | 0 | 4 | 0 | 0 | 0 | 0 | 4 | 0 |
| 2023 | 0 | 0 | 0 | 0 | 0 | 4 | 0 | 0 | 0 | 0 | 0 | 4 |
| 2024 | 0 | 0 | 0 | 0 | 0 | |||||||
| - = No Data Reported; -- = Not Applicable; NA = Not Available; W = Withheld to avoid disclosure of individual company data. |
| Release Date: 8/30/2024 |
| Next Release Date: 9/30/2024 |